Abstract
Plasma creatinine is a marker of interest in renal transplantation but data on its kinetics in the first days following transplantation are scarce. The aim of this study was to identify clinically relevant subgroups of creatinine trajectories following renal transplantation and to test their association with graft outcome. Among 496 patients with a first kidney transplant included in the French ASTRE cohort at the Poitiers University hospital, 435 patients from donation after brain death were considered in a latent class modeling. Four distinct classes of creatinine trajectories were identified: “poor recovery” (6% of patients), “intermediate recovery” (47%), “good recovery” (10%) and “optimal recovery” (37%). Cold ischemia time was significantly lower in the “optimal recovery” class. Delayed graft function was more frequent and the number of hemodialysis sessions was higher in the “poor recovery” class. Incidence of graft loss was significantly lower in “optimal recovery” patients with an adjusted risk of graft loss 2.42 and 4.06 times higher in “intermediate recovery” and “poor recovery” patients, respectively. Our study highlights substantial heterogeneity in creatinine trajectories following renal transplantation that may help to identify patients who are more likely to experience a graft loss.
Introduction
Kidney transplantation (KT) is optimal treatment for end-stage renal disease (ESRD), whether for the patient’s survival, his quality of life or the cost of treatment (,,).
Over the last two decades, the number of KTs has increased worldwide, in the number of transplantations from both living donors () and cadaveric donors (,). This phenomenon is due to an increase of patients with kidney failure, largely linked to longer life expectancy, and to an increase in prevalence of type 2 diabetes (). As a result, there has been a situation of kidney transplant shortage for several years which led to a rise in the number of patients on KT waiting list ().
Reducing the need for repeated transplantation by avoiding graft loss (GL) is a major objective. Despite progress in post-transplant management, particularly in terms of immunosuppressive treatments (,,), long-term graft survival has only slightly improved over recent years (,), with a median estimated at 14 years in France ().
Many predictive factors of long-term graft survival have been identified in recent years such as ischemia-reperfusion syndrome (,), delayed graft function (DGF) (,). Currently, post-transplant recovery assessment of the graft is based on consensual but not very reliable parameters. Plasma creatinine is a marker of interest for the clinician, but data on its kinetics in the first days following KT are scarce. Nadir creatinine and time to reach a creatinine level below 2.83 mg/dL during the transplant patient’s hospital stay are parameters commonly used by clinicians since they are considered to be independent prognostic factors for graft survival.
Daily creatinine values during the transplant patient’s hospital stay are available and consideration of their dynamic over time could yield additional predictive information.
Many statistical models have been developed to study the evolution of quantitative markers over time. One of them is the latent class mixed model (LCMM), which is an extension of the standard linear mixed model (). The model computes the heterogeneity of individual trajectories and identifies subgroups of patients with similar trajectory profiles, independently of their observed characteristics. This method has shown its interest in identifying subgroups of trajectories of renal function in a cohort of patients with chronic kidney disease (CKD) () and, more recently, in diabetic patients (,). While the LCMM has been applied for repeated measures of creatinine or glomerular filtration rate (GFR) (), it has never been used to describe subgroups of trajectories of renal recovery in the days following transplantation in renal recipients. LCMM could reveal unknown heterogeneity in post-KT trajectories of renal function which could help identify kidney recipients at high risk of GL.
Therefore, our aims were 1) to evaluate the ability of the LCMM to identify subgroups of trajectories of creatinine immediately following renal transplantation, 2) to identify the clinical factors associated with the different trajectories and 3) to test the association between subgroups of trajectories and graft outcomes.
Materials and Methods
Study Population
Patients were included if they met the following criteria: age ≥18 years; first KT from donation after brain death (DBD) between January 2008 and July 2017 at the Poitiers university hospital and enrollment in the French ASTRE cohort (). Non-inclusion criteria were living donors, donors after cardiac death (DCD), retransplantation, early graft failure, defined by recipient death or GL within 3 months, or primary non-function.
All patients signed informed consent before inclusion. The study follows the STROBE statement and was conducted following the principles of the Declaration of Helsinki and approved by the CNIL (Authorization number DR-2012- 518 [ps2]).
Expanded criteria donors (ECD) were defined by age >60 years or by age between 50 and 59 years with the association of two comorbidities: hypertension, creatinine ≥1.511 mg/dL or a cerebrovascular death (,,,).
Clinical and biological data
The demographic, clinical and biological data of the recipients and donors were collected in the ASTRE database. Post-KT hemodialysis session follow-up data was obtained from the electronic health record system by the Department of Medical Information of Poitiers University Hospital. Serum creatinine was determined daily, by enzymatic method in the Biochemistry department of Poitiers University Hospital. To establish the renal function trajectories following transplantation, we considered all the creatinine determinations during the hospital stay from 24 h after the transplant to hospital discharge.
Follow-Up and Outcome
Patients were followed up as were all the patients included in the French ASTRE cohort and the subsequent information was reported in the ASTRE database.
The main study outcome was occurrence of a graft loss from 3-month post-KT to last updating in July 2020 or to patient death. Secondary outcomes were creatinine values and HLA antibodies at 1-year post transplant, as well as HLA antibodies and acute cell rejection at latest news.
Statistical analysis
LCMM separating the population into homogeneous subgroups of individuals according to their creatinine trajectory was computed with the R “lcmm” package. Models with one to five classes were estimated and the number of classes was chosen by minimization of the Bayesian Information Criterion (BIC) and according to the size of identified subgroups.
Regarding the expected non-linearity of the trajectories, polynomial functions of time (2–5) were considered in the models. The models were adjusted for cold ischemia time, ECD, preemptive transplant and hemodialysis session completion, which were factors known to influence the dynamics of creatinine trajectories. Recipients were a posteriori classified in the class where they had the highest class-membership probability. The LCMM results are reported following the published “Guidelines for Reporting on Latent Trajectory Studies” ().
We performed a sensitivity analysis excluding creatinine values recorded within the 24 h following a hemodialysis session.
Clinical characteristics were compared between the different latent classes identified by Chi2 or Fisher tests for qualitative variables and by ANOVA or Kruskal-Wallis test for quantitative variables. Dunn’s post hoc tests were performed in case of significance.
Association between latent classes and GL at one year and at the date of latest news was tested by a chi2 test. Time to GL was described by Kaplan-Meier curves in each latent class and compared using a logrank test. Adjustment for all factors found associated with GL was performed using a Cox model. Other qualitative outcomes were tested by a chi2 test and creatine values at one year were tested by ANOVA or Kruskal-Wallis test.
Statistical analyses were performed with R software (R Foundation for Statistical Computing, Vienna, Austria, version 4.0.3).
The results were considered significant for p values < 0.05.
Results
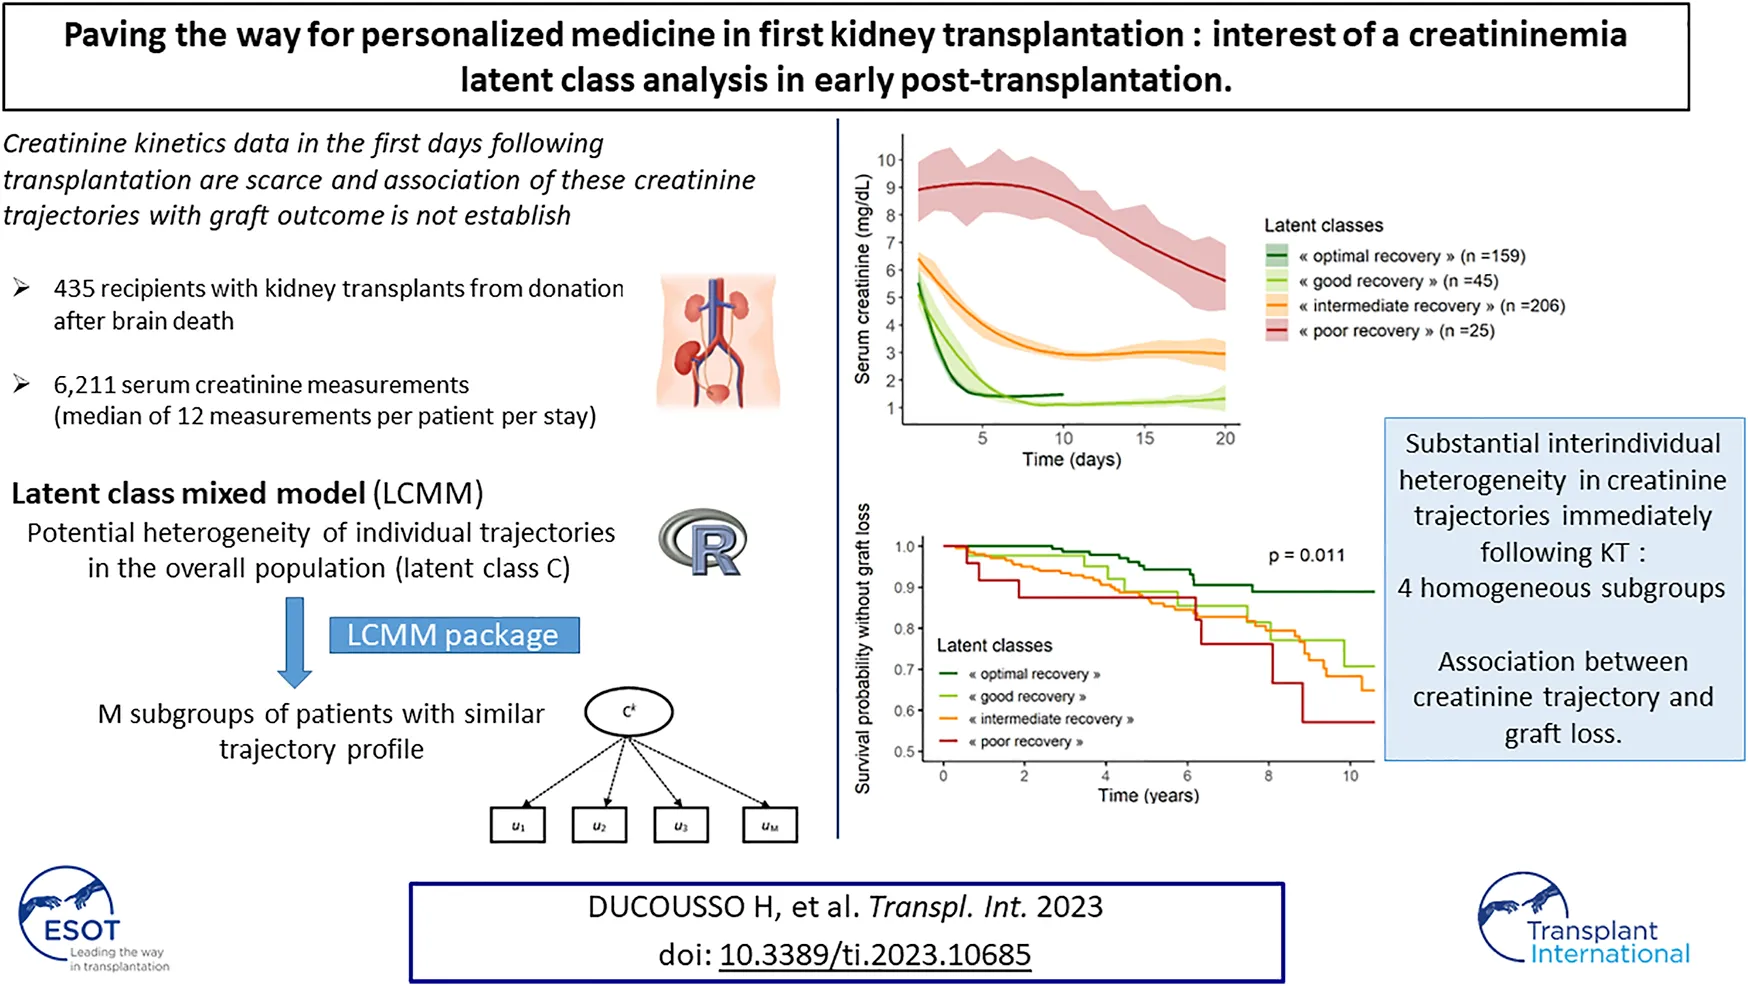
In the ASTRE cohort, 496 patients underwent a rank 1 KT at the Poitiers University Hospital. After applying the selection criteria, 435 recipients (258 males, 177 females aged 56 years) with kidney transplants from a DBD donor were included in the analysis (Figure 1).
FIGURE 1
Recipients, donors and transplants background characteristics are displayed in Table 1.
TABLE 1
| All (n = 435) | Class 1 (n = 25) poor recovery | Class 2 (n = 206) intermediate recovery | Class 3 (n = 45) good recovery | Class 4 (n = 159) optimal recovery | p | |
|---|---|---|---|---|---|---|
| Recipient characteristics | ||||||
| Age (years) | 56 (47–63) | 58 (49–65) | 56 (48–64) | 57 (46–62) | 56 (45–62) | 0.3989 |
| Male | 258 (59%) | 23 (92%) | 129 (63%) | 16 (36%) | 90 (57%) | <0.0001 |
| BMI, kg/m2 | 25 (22–28) | 27 (24–31) | 25 (23–29) | 24 (20–28) | 24 (21–27) | 0.0009 |
| CV disease | 389 (89%) | 24 (96%) | 181 (88%) | 38 (84%) | 146 (92%) | 0.2988 |
| Hypertension | 368 (85%) | 22 (88%) | 175 (85%) | 36 (80%) | 135 (85%) | 0.8224 |
| Diabetes | 61 (14%) | 2 (8%) | 31 (15%) | 7 (16%) | 21 (13%) | 0.8334 |
| PRA status | 0.0459 | |||||
| 0 to 25 | 367 (84%) | 22 (88%) | 177 (66%) | 31 (69%) | 137 (86%) | |
| 25 to 50 | 20 (5%) | 2 (8%) | 10 (5%) | 2 (4%) | 6 (4%) | |
| 50 to 100 | 48 (11%) | 1 (4%) | 19 (9%) | 12 (3%) | 16 (10%) | |
| Preemptive transplantation | 80 (18%) | 3 (12%) | 38 (18%) | 4 (9%) | 35 (22%) | 0.2009 |
| Waiting time on dialysis (month) (n = 355) | 15 (5–29) | 15 (9–30) | 14 (4–28) | 19 (10–34) | 16 (2–29) | 0.1005 |
| Pre-operative hemodialysis | 73 (16%) | 7 (28%) | 26 (13%) | 14 (31%) | 26 (16%) | 0.0109 |
| Donor characteristics | ||||||
| Age (years) | 55 (45–64) | 56 (52–64) | 56 (48–65) | 54 (40–62) | 55 (40–64) | 0.1389 |
| Male | 255 (59%) | 18 (72%) | 116 (56%) | 30 (67%) | 91 (57%) | 0.3049 |
| BMI, kg/m2 | 25 (22–29) | 25 (21–29) | 25 (23–29) | 25 (22–29) | 25 (22–28) | 0.6943 |
| Expanded criteria donor | 202 (46%) | 12 (48%) | 104 (50%) | 16 (36%) | 70 (44%) | 0.2729 |
| Hypertension | 137 (31%) | 7 (28%) | 81 (39%) | 11 (24%) | 38 (24%) | 0.0082 |
| Diabetes | 32 (7%) | 3 (12%) | 17 (8%) | 2 (4%) | 10 (6%) | 0.5918 |
| Transplantation characteristics | ||||||
| Cold ischemia time (hours) | 15 (12–18) | 16 (13–18) | 15 (13–18) | 17 (13–22) | 14 (12–17) | 0.0093 |
| Hypothermic machine perfusion | 113 (26%) | 5 (20%) | 53 (26%) | 7 (16%) | 48 (30%) | 0.2259 |
| HLA-A mismatches | 0.314 | |||||
| 0 | 56 (13%) | 3 (12%) | 28 (14%) | 10 (22%) | 15 (9%) | |
| 1 | 236 (54%) | 16 (64%) | 114 (55%) | 21 (47%) | 85 (53%) | |
| 2 | 143 (33%) | 6 (24%) | 64 (31%) | 14 (31%) | 59 (37%) | |
| HLA-B mismatches | 0.7986 | |||||
| 0 | 24 (6%) | 2 (8%) | 9 (4%) | 4 (9%) | 9 (6%) | |
| 1 | 201 (46%) | 10 (40%) | 97 (47%) | 22 (49%) | 72 (45%) | |
| 2 | 210 (48%) | 13 (52%) | 100 (49%) | 19 (42%) | 78 (49%) | |
| HLA-DR mismatches | 0.5899 | |||||
| 0 | 106 (24%) | 2 (7%) | 50 (24%) | 11 (25%) | 43 (28%) | |
| 1 | 240 (55%) | 17 (63%) | 116 (56%) | 25 (57%) | 82 (53%) | |
| 2 | 89 (20%) | 8 (30%) | 42 (20%) | 8 (18%) | 31 (20%) | |
Recipient, donor and transplant background characteristics in the overall population according to latent classes.
Numbers are median (25th-75th percentiles) or effective (%); BMI, body mass index; PRA, panel reactive antibody.
The bold values are the significant values.
Between 24 h post-KT and hospital discharge, 6,211 serum creatinine measurements were recorded in the 435 patients corresponding to a median of 12 (,,,,) measurements per patient per stay in agreement with median hospital stay duration. As shown in Table 2, delayed graft function was observed in 80 patients (18%) and a median number of 2 (,,) hemodialysis sessions was needed during the hospital stay.
TABLE 2
| All (n = 435) | Class 1 (n = 25) poor recovery | Class 2 (n = 206) intermediate recovery | Class 3 (n = 45) good recovery | Class 4 (n = 159) optimal recovery | p | |
|---|---|---|---|---|---|---|
| Postgraft creatininemia at 24 h, mg/dL | 6 (4–8) | 9 (7–11) | 6 (5–8) | 5 (4–7) | 6 (4–7) | <0.0001 |
| Delayed graft function | 80 (18%) | 19 (76%) | 43 (21%) | 6 (13%) | 12 (8%) | <0.0001 |
| Nb. of hemodialysis sessions | 2 (2–4) | 4 (3–8) | 2 (1–4) | 2 (2–3) | 2 (2–2) | 0.0057 |
| Time to reach the 2.83 mg/dL threshold (days) | 3 (2–5) | 33 (27–39) | 4 (3–8) | 3 (2–4) | 3 (2–3) | <0.0001 |
| Nadir creatinine | 138 (103–202) | 396 (302–450) | 184 (140–237) | 88 (71–106) | 107 (90–135) | <0.0001 |
| Patient’s hospital stay duration | 12 (11–15) | 20 (17–24) | 13 (12–17) | 13 (11–15) | 11 (10–12) | <0.0001 |
Post-transplant characteristics in the overall population according to latent classes.
Numbers are median (25th-75th percentiles) or effective (%); Delayed Graft Function: the need for a hemodialysis session in the first 7 days post-transplantation.
The bold values are the significant values.
During median follow-up of 73 (48–107) months, 68 patients (16%) lost their graft. At year one 7 GL (2%) and 39 T cell acute rejections (9%) were recorded.
Subgroups of Serum Creatinine Trajectories
The choice of the various LCMM parameters are detailed in Supplementary Table S1. The best model, with the lowest BIC and a high entropy, determined 4 latent classes, whether there were adjustment variables or not (Supplementary Table S2). The mean posterior probabilities of class membership for individuals ranged from 81% to 87%, indicating good overall discrimination ability regarding the adjusted model.
The mean trajectories of creatinine in the four latent classes are shown on Figure 2.
FIGURE 2
Class 1 (“poor recovery”) contained 25 patients (6%) with high values of serum creatinine at day 1, around 9 mg/dL, which decreased slowly over time, ending at 5.5 mg/dL at day 20 post KT. Class 2 (“intermediate recovery”) was the more numerous one with 206 patients (47%) showing moderate values of creatinine at day 1, around 6.5 mg/dL, which fell to 3 mg/dL within 10 days post-KT. Patients classified in Class 3 (“good recovery”, n = 45, 10%) and patients in Class 4 (“optimal recovery,” n = 159, 37%) had the lowest creatinine values at day 1, 5, and 5.5 mg/dL respectively; they both dropped to approximately 1.1–1.3 mg/dL at day 8 and day 4 respectively. After this pronounced diminution, “good recovery” patients’ creatinine remained stable, whereas “optimal recovery” patients’ creatinine showed a small rise of approximately 0.5 mg/dL from day 5 to day 10.
LCMM performed on the database excluding creatinine values reported within the 24 h following a hemodialysis session gave comparable results, identifying four classes with similar trajectories (n = 23 in Class 1, n = 204 in Class 2, n = 44 in Class 3 and n = 164 in Class 4).
Characteristics of recipients and donors according to renal function trajectories
The characteristics of the recipients, donors and transplants according to the 4 latent classes are shown in Table 1. Recipients did not differ in age, history of hypertension, diabetes or immunization. Men and recipients with high body mass index (BMI) were more represented in the “poor recovery” class (92% men, median BMI value: 27 (,,,,,,,31) kg/m2). Frequency of pre-emptive transplantation and waiting time on dialysis did not differ between classes.
Characteristics of donors did not differ between the four groups, including ECD criteria.
Regarding transplant characteristics, the median of cold ischemia time was different between the four classes (p = 0.0093); it was significantly lower in the “optimal recovery” group compared to the “good recovery” group (p = 0.0074).
Multivariate polynomial logistic regression showed that donor hypertension and cold ischemia time were the only independent predictors of latent classes with R-squared (R2) value not exceeding 6%.
In post-KT (Table 2), 24-hour creatinine values were significantly lower in “optimal recovery” and “good recovery” classes than in the others. DGF was more frequent and the number of hemodialysis sessions was higher in “poor recovery” recipients than in the others. Moreover, the time to reach the 2.83 mg/dL creatinine threshold and the nadir creatinine were significantly higher for “poor recovery” recipients. The latter had a significantly longer hospital stay than the others.
Prognosis values of latent classes of creatinine
The proportion of recipients with GL during follow-up was significantly lower in “optimal recovery” patients (pchi-deux = 0.0015) (Table 3). Considering time to event, incidence of GL was also lower in “optimal recovery” patients (plogrank = 0.011) (Figures 3, 4). After adjustment for all factors found associated with GL in a univariate analysis (Supplementary Table S3), trajectories of creatinine were still significantly associated with GL: Compared with “optimal recovery” class, the risk of graft loss was 2.42 times higher for patients classified in “intermediate recovery” class and 4.06 times higher for patients classified in “poor recovery” class (Table 4). of note, nadir creatinine during hospital stay did not remain associated with GL when latent classes were considered in the model (p > 0.9).
TABLE 3
| All (n = 435) | Class 1 (n = 25) poor recovery | Class 2 (n = 206) intermediate recovery | Class 3 (n = 45) good recovery | Class 4 (n = 159) optimal recovery | p | |
|---|---|---|---|---|---|---|
| Follow-up duration (months) | 73 (48–107) | 83 (49–106) | 72 (48–107) | 85 (48–118) | 73 (48–98) | 0.773 |
| Graft loss, n (%) | ||||||
| latest news | 68 (16%) | 7 (28%) | 41 (20%) | 8 (18%) | 12 (8%) | 0.0015 |
| at year 1 | 7 (2%) | 2 (8%) | 4 (2%) | 1 (2%) | 0 (0%) | 0.0264 |
| Postgraft creatininemia at year 1, mg/dL (n = 428)* | 1 (1–2) | 2 (1–2) | 2 (1–2) | 1 (1–1) | 1 (1–2) | <0.0001 |
| T cell acute rejection at year 1, n (%) | 39 (9%) | 4 (16%) | 18 (9%) | 2 (4%) | 15 (9%) | 0.4478 |
| Anti-HLA antibodies, n (%) | ||||||
| at year 1 (n = 412)* | 55 (13%) | 4 (16%) | 22 (11%) | 6 (13%) | 23 (14%) | 0.5726 |
| latest news (n = 415)* | 76 (17%) | 6 (24%) | 37 (18%) | 7 (16%) | 26 (16%) | 0.6626 |
Graft outcomes in the overall population according to the different latent classes.
Numbers are median (25th-75th percentiles) or effective (%); *7 patients lost their graft during the first year.
The bold values are the significant values.
FIGURE 3
FIGURE 4
TABLE 4
| Characteristic | HRa | 95% CIa | p |
|---|---|---|---|
| Pre-emptive graft | 0.028 | ||
| No | — | — | |
| Yes | 0.43 | 0.18, 1.00 | |
| BMI donor, kg/m2 | 1.05 | 1.01, 1.10 | 0.014 |
| Expanded criteria donor | <0.001 | ||
| No | — | — | |
| Yes | 2.54 | 1.49, 4.35 | |
| HLA-B mismatches | 0.033 | ||
| 0 | — | — | |
| 1 | 0.29 | 0.12, 0.68 | |
| 2 | 0.41 | 0.18, 0.93 | |
| Latent classes | 0.010 | ||
| « optimal recovery » | — | — | |
| « good recovery » | 2.07 | 0.84, 5.11 | |
| « intermediate recovery » | 2.42 | 1.26, 4.63 | |
| « poor recovery » | 4.06 | 1.59, 10.4 |
Predictive factors of graft loss: Cox regression model.
HR, adjusted Hazard Ratio; CI, confidence interval.
The bold values are the significant values.
Serum creatinine levels one year after KT were significantly different between the four classes with higher levels in “poor recovery” recipients (median of 2 (,) mg/dL) and lower levels in “optimal recovery” and “good recovery” recipients (medians of 1 () mg/dL and 1 (,) mg/dL respectively).
Biopsy-proven acute T cell rejection was found in 39 patients (9%) one year after KT and did not differ between the four latent classes.
Anti-HLA antibodies were not found significantly different between the latent classes neither at one year after KT nor at the latest news.
Discussion
In the present study, using a retrospective cohort of 435 kidney transplant recipients, we performed a LCMM and highlighted substantial heterogeneity in renal function recovery immediately following KT from DBD. Interestingly, we identified four distinct trajectories showing non-linear decrease in daily creatinine levels during the initial hospitalization for transplantation.
These trajectories showed heterogeneity between patients regarding both creatinine level at day 1 and speed of the decrease, which reflects graft recovery. Patients with “optimal” or “good recovery” represented 37% and 10% of the study population, respectively, and their creatinine values dropped quickly. Patients with “intermediate recovery” had higher creatinine values at day one and a slower decrease over time, and they were the most numerous, representing 47% of the population. Finally, 6% of patients presented a trajectory markedly different from the others, with high initial values and a delayed and small decrease (“poor recovery”). The slight increase observed in the trajectory of the “optimal recovery” group could be due to the renal toxicity of the calcineurin inhibitors.
Although baseline characteristics were poor predictors of these trajectories, some clinically relevant variables such as cold ischemia time were associated with the trajectories. Interestingly, kidney donor hypertension, but not ECD, was also associated with the trajectories: in the “optimal recovery” trajectory, the lowest cold ischemia time and rate of hypertensive donors were found. The use of machines perfusion did not differ significantly between the different latent classes.
The four trajectories were also associated with relevant post-KT characteristics. As expected, patients classified in the “poor recovery” class were more likely to have DGF. Furthermore, they had the highest nadir creatinine and the longest time in days needed to reach the creatinine threshold of 2.83 mg/dL. “Good” and “optimal recovery” trajectories did not differ significantly in terms of time needed to reach the 2.83 mg/dL creatinine threshold.
Regarding graft outcome, the four trajectories were found to be an independent prognostic factor. In the literature, there are a few risk scores predicting graft loss, which include mainly donor and baseline transplant characteristics as prognostic factors (,). Cold ischemia time is identified as a risk factor for reduced graft and patient survival and DGF (). The hypothermic perfusion machine also reduces the DGF incidence from 38% to 24% (). Moreover, it is demonstrated that the survival of grafts at 1 year is 92.3% for grafts placed on a hypothermic machine perfusion, versus 80.2% for grafts with cold storage (31). During the first few months post-KT, 3-, 6- and 12-month eGFR have been reported as prognostic values (32) such as creatinine and eGFR trajectories beyond one year of follow-up (,33). Nevertheless, none of these risk scores takes into consideration the evolution of daily creatinine levels in early post-KT. To our knowledge, our study is the first to characterize renal recovery trajectories immediately following KT, using the latent class analysis tool. Consideration of these daily determinations of creatinine during the hospital stay could be more relevant to predict GL than isolated values such as nadir of creatinine level.
The use of LCMM for the identification of trajectories of renal function evolution has raised a lot of interest in recent years (,34). This novel unsupervised approach overlooks prior assumptions on the evolution of creatinine as a means of classifying patients. Our model was fitted on several covariates known to influence renal recovery, and this statistical fitting results in independency between these covariates and the identified trajectories. More specifically, the impact of hemodialysis sessions was taken into account as a time-dependent variable since it induces a drop in creatinine levels that gradually affects the creatinine levels, up to 24–48 h after the session. In a sensitivity analysis, we applied the model on the subset of data free of post-hemodialysis creatinine values and obtained four latent classes comparable to the previous ones.
Regarding the clinical applicability of our models, the type of recovery for a given recipient could be estimated outside the framework of this study. Indeed, the available hospital stay creatinine values and the covariates present in the model could be calculated in a dedicated application which would indicate the class membership probabilities. Hence, transplant recipients at higher risk of graft loss could be identified upon their hospital discharge, enabling personalized follow-up frequency and better management.
This study has several limitations, particularly its monocentric design. Selection bias regarding recipients and donors might have conditioned class-membership. External validation is needed to confirm the general applicability of a LCMM. Moreover, an analysis conducted on Maastricht-III and living donors could be of particular interest.
In conclusion, substantial inter-individual heterogeneity in creatinine trajectories immediately following KT was highlighted. Insight into a recovery class might lead to more precise estimation of risk of graft loss for a given patient and be conducive to optimized post-KT management.
Statements
Data availability statement
The original contributions presented in the study are included in the article/Supplementary Material, further inquiries can be directed to the corresponding author.
Ethics statement
The studies involving human participants were reviewed and approved by Commission nationale de l’informatique et des libertés (CNIL). The patients/participants provided their written informed consent to participate in this study.
Author contributions
HD, SR, and AT contributed to conception and design of the study. FD and IC organized the database. IC performed the statistical analysis. HD wrote the first draft of the manuscript. MV, TK, SR, IC, and AT wrote sections of the manuscript. All authors contributed to manuscript revision, read, and approved the submitted version.
Acknowledgments
The authors thanks all medical et nursing staff especially Elise Gand, Charlotte Castel, Julie Paul, and Jean Laporte for their commitment and professionalism.
Conflict of interest
The authors declare that the research was conducted in the absence of any commercial or financial relationships that could be construed as a potential conflict of interest.
Supplementary material
The Supplementary Material for this article can be found online at: https://www.frontierspartnerships.org/articles/10.3389/ti.2023.10685/full#supplementary-material
Abbreviations
BIC, Bayesian Information Criterion; BMI, Body Mass Index; CKD, Chronic Kidney Disease; DBD, Death after Brain Death; DGF, Delayed Graft Function; ECD, Expanded Criteria Donor; ESRD, End-Stage Renal Disease; GFR, Glomerular Filtration Rate; GL, Graft Loss; KT, Kidney Transplantation; LCMM, Latent Class Mixed Model.
References
1.
Autorité de SantéH. Évaluation médico-économique des stratégies de prise en charge de l’insuffisance rénale chronique terminale en France (2014). Available from: https://www.has-sante.fr/jcms/c_1775180/fr/evaluation-medico-economique-des-strategies-de-prise-en-charge-de-l-insuffisance-renale-chronique-terminale-en-france (Accessed October 21, 2019).
2.
TonelliMWiebeNKnollGBelloABrowneSJadhavDet alSystematic Review: Kidney Transplantation Compared with Dialysis in Clinically Relevant Outcomes. Am J Transpl (2011) 11(10):2093–109. 10.1111/j.1600-6143.2011.03686.x
3.
BlotièrePOTuppinPWeillARicordeauPAllemandH. The Cost of Dialysis and Kidney Transplantation in France in 2007, Impact of an Increase of Peritoneal Dialysis and Transplantation. Nephrol Ther (2010) 6(4):240–7. 10.1016/j.nephro.2010.04.005
4.
GaillardFJacquemontLRobertsVAlbanoLAllardJBouvierNet alTemporal Trends in Living Kidney Donation in France between 2007 and 2017. Nephrol Dial Transpl (2021) 36(4):730–8. 10.1093/ndt/gfz229
5.
PippiasMJagerKJKramerALeivestadTSánchezMBCaskeyFJet alThe Changing Trends and Outcomes in Renal Replacement Therapy: Data from the ERA-EDTA Registry. Nephrol Dial Transpl (2016) 31(5):831–41. 10.1093/ndt/gfv327
6.
KnollG. Trends in Kidney Transplantation over the Past Decade. Drugs (2008) 68(1):3–10. 10.2165/00003495-200868001-00002
7.
Agence de la Biomédecine. Rapport Annuel 2019 – REIN (2021). Available from: https://www.agence-biomedecine.fr/Les-chiffres-du-R-E-I-N (Accessed April 19, 2022).
8.
PirschJDPloegRJGangeSD'AlessandroAMKnechtleSJSollingerHWet alDeterminants of Graft Survival after Renal Transplantation. Transplantation (1996) 61(11):1581–6. 10.1097/00007890-199606150-00006
9.
HariharanSJohnsonCPBresnahanBATarantoSEMcIntoshMJStableinD. Improved Graft Survival after Renal Transplantation in the United States, 1988 to 1996. N Engl J Med (2000) 342(9):605–12. 10.1056/NEJM200003023420901
10.
Meier-KriescheHUScholdJDSrinivasTRKaplanB. Lack of Improvement in Renal Allograft Survival Despite a Marked Decrease in Acute Rejection Rates over the Most Recent Era. Am J Transpl (2004) 4(3):378–83. 10.1111/j.1600-6143.2004.00332.x
11.
CoemansMSüsalCDöhlerBAnglicheauDGiralMBestardOet alAnalyses of the Short- and Long-Term Graft Survival after Kidney Transplantation in Europe between 1986 and 2015. Kidney Int (2018) 94(5):964–73. 10.1016/j.kint.2018.05.018
12.
ZhaoHAlamASooAPGeorgeAJTMaD. Ischemia-Reperfusion Injury Reduces Long Term Renal Graft Survival: Mechanism and beyond. EBioMedicine (2018) 28:31–42. 10.1016/j.ebiom.2018.01.025
13.
SaatTCvan den AkkerEKIjzermansJNDorFJde BruinRW. Improving the Outcome of Kidney Transplantation by Ameliorating Renal Ischemia Reperfusion Injury: Lost in Translation?J Transl Med (2016)(20) 14. 10.1186/s12967-016-0767-2
14.
MallonDHSummersDMBradleyJAPettigrewGJ. Defining Delayed Graft Function after Renal Transplantation: Simplest Is Best. Transplantation (2013) 96(10):885–9. 10.1097/TP.0b013e3182a19348
15.
YarlagaddaSGCocaSGFormicaRNJrPoggioEDParikhCR. Association between Delayed Graft Function and Allograft and Patient Survival: a Systematic Review and Meta-Analysis. Nephrol Dial Transpl (2009) 24(3):1039–47. 10.1093/ndt/gfn667
16.
Proust-LimaCPhilippsVLiquetB. Estimation of Extended Mixed Models Using Latent Classes and Latent Processes: The R Package Lcmm. J Stat Softw (2017) 78(2):1–56. 10.18637/jss.v078.i02
17.
BoucquemontJLoubèreLMetzgerMCombeCStengelBLeffondreKet alIdentifying Subgroups of Renal Function Trajectories. Nephrol Dial (2017) 32(2):ii185–93. 10.1093/ndt/gfw380
18.
JiangGLukAOYTamCHTXieFCarstensenBLauESHet alProgression of Diabetic Kidney Disease and Trajectory of Kidney Function Decline in Chinese Patients with Type 2 Diabetes. Kidney Int (2019) 95(1):178–87. 10.1016/j.kint.2018.08.026
19.
VistisenDAndersenGSHulmanAPerssonFRossingPJørgensenME. Progressive Decline in Estimated Glomerular Filtration Rate in Patients with Diabetes after Moderate Loss in Kidney Function-Even without Albuminuria. Diabetes Care (2019) 42(10):1886–94. 10.2337/dc19-0349
20.
RaynaudMAubertOReesePPBouatouYNaesensMKamarNet alTrajectories of Glomerular Filtration Rate and Progression to End Stage Kidney Disease after Kidney Transplantation. Kidney Int (2021) 99(1):186–97. 10.1016/j.kint.2020.07.025
21.
ASTRE Portal. Astre-Greffe. Available from: https://www.astre-greffe.fr/lportal/web/astre (Accessed May 19, 2022).
22.
PessioneFCohenSDurandDHourmantMKesslerMLegendreCet alMultivariate Analysis of Donor Risk Factors for Graft Survival in Kidney Transplantation. Transplantation (2003) 75(3):361–7. 10.1097/01.TP.0000044171.97375.61
23.
PortFKBragg-GreshamJLMetzgerRADykstraDMGillespieBWYoungEWet alDonor Characteristics Associated with Reduced Graft Survival: an Approach to Expanding the Pool of Kidney Donors. Transplantation (2002) 74(9):1281–6. 10.1097/00007890-200211150-00014
24.
ReschTCardiniBOberhuberRWeissenbacherADumfarthJKrapfCet alTransplanting Marginal Organs in the Era of Modern Machine Perfusion and Advanced Organ Monitoring. Front Immunol (2020)(631) 11. 10.3389/fimmu.2020.00631
25.
MetzgerRADelmonicoFLFengSPortFKWynnJJMerionRM. Expanded Criteria Donors for Kidney Transplantation. Am J Transpl (2003) 3(4):114–25. 10.1034/j.1600-6143.3.s4.11.x
26.
Van de SchootRSijbrandijMWinterSDDepaoliSVermuntJK. The GRoLTS-Checklist: Guidelines for Reporting on Latent Trajectory Studies. Struct Equation Model (2017) 24(3):451–67. 10.1080/10705511.2016.1247646
27.
RosengardBRFengSAlfreyEJZaroffJGEmondJCHenryMLet alReport of the Crystal City Meeting to Maximize the Use of Organs Recovered from the Cadaver Donor. Am J Transpl (2002) 2(8):701–11. 10.1034/j.1600-6143.2002.20804.x
28.
SummersDMJohnsonRJAllenJFuggleSVCollettDWatsonCJet alAnalysis of Factors that Affect Outcome after Transplantation of Kidneys Donated after Cardiac Death in the UK: a Cohort Study. Lancet (2010) 376(9749):1303–11. 10.1016/S0140-6736(10)60827-6
29.
DeboutAFoucherYTrébern-LaunayKLegendreCKreisHMouradGet alEach Additional Hour of Cold Ischemia Time Significantly Increases the Risk of Graft Failure and Mortality Following Renal Transplantation. Kidney Int (2015) 87(2):343–9. 10.1038/ki.2014.304
30.
SavoyeEMacherMAVidecoqMGataultPHazzanMAbboudIet alEvaluation of Outcomes in Renal Transplantation with Hypothermic Machine Perfusion for the Preservation of Kidneys from Expanded Criteria Donors. Clin Transpl (2019) 33(5):e13536. 10.1111/ctr.13536
31.
TreckmannJMoersCSmitsJMGallinatAMaathuisMHvan Kasterop-KutzMet alMachine Perfusion versus Cold Storage for Preservation of Kidneys from Expanded Criteria Donors after Brain Death. Transpl Int (2011) 24(6):548–54. 10.1111/j.1432-2277.2011.01232.x
32.
MottolaCGirerdNDuarteKAarninkAGiralMDantalJet alPrognostic Value for Long-Term Graft Survival of Estimated Glomerular Filtration Rate and Proteinuria Quantified at 3 Months after Kidney Transplantation. Clin Kidney J (2020) 13(5):791–802. 10.1093/ckj/sfaa044
33.
StamenicDRousseauAEssigMGataultPBuchlerMFillouxMet alA Prognostic Tool for Individualized Prediction of Graft Failure Risk within Ten Years after Kidney Transplantation. J Transpl (2019) 2019(7245142):1–10. 10.1155/2019/7245142
34.
PurnajoIBeaumontJLPolinskyMAlemaoEEverlyMJ. Trajectories of Health-Related Quality of Life Among Renal Transplant Patients Associated with Graft Failure and Symptom Distress: Analysis of the BENEFIT and BENEFIT-EXT Trials. Am J Transpl (2020) 20(6):1650–8. 10.1111/ajt.15757
Summary
Keywords
donation after brain death, chronic kidney disease, latent class mixed model, kydney transplantation, trajectories, creatinine
Citation
Ducousso H, Vallée M, Kerforne T, Castilla I, Duthe F, Saulnier P-J, Ragot S and Thierry A (2023) Paving the Way for Personalized Medicine in First Kidney Transplantation: Interest of a Creatininemia Latent Class Analysis in Early Post-transplantation. Transpl Int 36:10685. doi: 10.3389/ti.2023.10685
Received
02 June 2022
Accepted
10 January 2023
Published
16 February 2023
Volume
36 - 2023
Updates
Copyright
© 2023 Ducousso, Vallée, Kerforne, Castilla, Duthe, Saulnier, Ragot and Thierry.
This is an open-access article distributed under the terms of the Creative Commons Attribution License (CC BY). The use, distribution or reproduction in other forums is permitted, provided the original author(s) and the copyright owner(s) are credited and that the original publication in this journal is cited, in accordance with accepted academic practice. No use, distribution or reproduction is permitted which does not comply with these terms.
*Correspondence: Antoine Thierry, antoine.thierry@chu-poitiers.fr
Disclaimer
All claims expressed in this article are solely those of the authors and do not necessarily represent those of their affiliated organizations, or those of the publisher, the editors and the reviewers. Any product that may be evaluated in this article or claim that may be made by its manufacturer is not guaranteed or endorsed by the publisher.