Abstract
Until now, the contribution of soils in urban spaces has been underestimated and, as a result, the services they provide have been severely undervalued in urban planning. This article aims to address this issue through a study of Chapultepec Park in Mexico City. We provide two methodological proposals for the analysis of soil ecosystem services characterized by the interaction of natural and anthropic processes: the morpho-pedological landscapes (MpL), in which we quantify soil carbon sequestration (SOC Mg ha−1) and the comparison of two methods for the analysis of hydraulic conductivity: Pedotransfer functions (PTF) and direct measurement with a double ring infiltrometer. Among the 12 MpL, we found the highest SOC content in slopes with mixed tree vegetation and Phaeozem soils. However, SOC retention decreased by 40%–50% due to sealing surfaces. For infiltration measures, despite the diversity of soils and vegetation, direct measurements values are highly homogeneous, while values calculated using PTFs better reflect the morphopedological landscape heterogeneity. In all the MpLs, the hydraulic conductivity was higher than the maximum rainfall intensity report, indicating that the soils in Chapultepec Park, despite the differences in soils and intensity of use, provide the ecosystem service of infiltration. These results would allow the establishment of a baseline for monitoring these services and provide information to decision makers and urban planners seeking to reduce the construction of gray infrastructure that seals soils and reduces their capacity to provide these ecosystem services.
Introduction
Urban parks have a strategic importance for the quality of life of our increasingly urbanized society (). These are multifunctional and produce co-benefits such as urban greening for heat mitigation, habitat creation, and human health and wellbeing () and may increase urban resilience to sudden change, disruptions and natural disasters. In these spaces, the soils fulfill essential functions that allow the provision of ecosystem services such as carbon and nitrogen sequestration (; ), climate regulation and water infiltration and purification ().
Urban parks, as nature-based solutions, should have an adaptive management (Sowinska-Swierkosz and García, 2022), this requires accurate information at an appropriate scale. Especially in order to incorporate these green spaces into urban planning, it is necessary to more practice-based evidence (). Until now the ecosystem services, specially the role of soils is less appreciated (), the data on carbon sequestration in these soils is still inconclusive () and inconsistently quantified in literature (; Jones et al., 2022). Incomplete information impedes the understanding of the multiple benefits of urban parks, making it difficult for policymakers to make sustainable decisions.
Usually in urban areas, impermeable materials such as concrete, metal, glass or plastic seal the ground. Soil sealing is one of the most common consequences of urbanization and one of the main threats to soils (van der Putten et al., 2018) as it produces various negative effects, including the impossibility of energy transfer, gas exchange, water movement and the presence of microbial activity (Scalenghe and Ajmone Marsan, 2009). The main impacts of sealing include the loss of vegetation, the alteration of the local microclimate due to the increase in atmospheric temperature (Scalenghe and Ajmone Marsan, 2009), it also reduces water infiltration (), decreases carbon and nutrient content () and increases surface runoff (Ungaro et al., 2014).
In Latin America, the physical expansion of cities is greater than population growth (). Moreover these cities will show in the coming decades the most rapid urban growth with numerous informal settlements and vulnerable places (). Mexico City is no exception, with nearly 9 million people, has a total of 2643 ha of green areas, which means only 2.93 m2 green area/person (), below the minimum threshold of 9 m2/person recommended (World Health Organization, 2009). However, the steady growth of urbanization threatens the permanence of green spaces, which are continually sealed. While urban planning has long recognized the importance of the green spaces, incorporation of ecosystem services into public policies is still incipient in Latin America because several institutional barriers ().
Mexico City has few green spaces, which are unevenly distributed and affect marginalized populations (). In addition, the ecosystem services of other urban parks are still unknown due to a lack of studies and evaluations. This lack of data is a major disadvantage when deciding on the best use of an area within the city. Urban parks, as NbS, should be based on the theory of change, iterative learning and adaptive management (Sowinska-Swierkosz and García, 2022). In fact, these authors mention that we should not call an effective NbS actions that do not monitor the performance of solutions at the landscape level. However, the soil ecosystem services that underpin urban parks are inconsistently quantified in the literature (Jones et al., 2022). Therefore, there is a need and urgency to assess and monitor them.
In cities, every square meter saved has value. While in urban ecosystems we must make some trade-offs between cultural and environmental ecosystem services, this decision must be based on accurate data and information to maximize the potential of each site. In cities, there is always strong pressure to build on any open space, despite the recognition that green spaces, and especially urban parks, improve the quality of life. However, the management of these spaces largely determines the provision of ecosystem services, so it is important to establish assessment mechanisms, particularly for soil quality, to provide decision-makers with accurate information to help them understand and clarify the impacts that would result from their loss. In this sense, in the context of climate change and its impact on cities, information on SOC sequestration and infiltration should guide urban planning decisions.
Given Mexico City’s significant CO2 emissions and vulnerability due to water scarcity, coupled with droughts and floods (Zambrano et al., 2017), the government of Mexico City has enacted a Climate Change Mitigation and Adaptation Law, that aims to, among other things, capture carbon and promote water infiltration ().
In light of the above, this study aims to highlight the key ecosystem services of urban park soils, such as carbon sequestration and water infiltration regulation. We believe that assessing the soil ecosystem services of urban parks is crucial for their management and restoration, and ultimately to provide policymakers and planners with relevant information to design a more sustainable city.
Methods
Study Area
Chapultepec park is in the north western part of Mexico City, at an average altitude of 2355 m.a.s.l. (with an altitude range between 2250 and 2460 masl) (Figure 1). The climate is temperate sub-humid with rains in summer (700–1,000 mm/year) and average annual temperature between 12°C and 18°C.
FIGURE 1
Chapultepec Park is one of the oldest urban parks in the Americas, and its 850 ha represent 32% of Mexico City’s green areas. Administratively, the park is divided into four sections. The first two sections (I and II) are located in the lower part of the park, close to the road and public transportation infrastructure. In these sections are the main constructions (museums, parking lots, artificial lakes), whose sealed areas reach 45% and 52%, respectively (). These sections are also the ones that receive the largest number of visitors: 13 million people per year (PUEC, 2002).
The third section, incorporated in 1974, is located in the upper-middle part of the park, isolated from public transportation infrastructure, with no cultural facilities or parking lots, so its sealed area is only of 14% ().
The fourth section was the last to be added to this park by the city government (2019). Previously, it was occupied by military installations that sealed 24% of this area.
The soils in the first two sections were intensively managed over the years. They were fertilized with urea until 2019, and from that year on, only foliar fertilization of ornamental plants will be used for reinforcement (about 2-3 sprays per year). On the other hand, compost is regularly added. The soils in the first section are continuously irrigated with treated water (secondary treatment to remove pollutants and odours). The soils around the artificial lakes have received sediment from dredging. Finally, in these sections, the leaves on the bare ground are swept as an aesthetic practice.
Morpho-Pedological Landscapes (MpL)
The study of urban soils is challenged by extreme lateral and vertical heterogeneity, and complex interactions between humans and other soil-forming factors (climate, parent material, topography, organisms, time) complicate the definition of a representative set of soil observations (). In addition, soil characteristics and quality, their distribution and the biogeochemical processes that occur are the result of interactions and retroactions between geological and geomorphological features, landform evolution, parent material type, drainage and plant cover. Therefore, it is more appropriate to think in terms of morpho-pedological landscapes, both spatially and process-wise. These landscape units allow for comprehensive, multidisciplinary approaches that could help unravel the complex spatial patterns of such soils () and thereby select optimal soil sampling sites. In this study, the morpho-edaphological units were defined by superimposing soil-forming factors (relief, geology, vegetation) in a GIS context. The preliminary morpho-pedological map was made with information from a Digital Terrain Model with a resolution.
The field verification of each morpho-pedological landscape (MpL) identified the intensity of visitor use and soil degradation; this information was incorporated into each MpL because it affects soil quality.
Soil Survey and Analysis
Soil sampling sites were located within each MpL. At each site, pits were dug to investigate soil properties in each soil horizon (Siebe et al., 2016) and to collect soil samples for organic carbon analysis, texture, pH, and bulk density in the laboratory. A total of 28 samples were collected from 8 pits. The soils were classified using USS Working Group WRB (2022) based on field description and laboratory analysis.
Since the first two sections have undergone many changes and their soils contain historical artifacts, the National Institute of Anthropology and History (INAH) gave permission to excavate only one pit in the first two sections. Therefore, there are 8 soil profiles in 12 MpL.
In addition, undisturbed surface soil samples (0–5 cm) were taken with cylindrical soil corers (100 mL) to determine bulk density, sand (%), clay (%), and soil organic carbon (%) (Table 1). The weight of rock (if present) was subtracted to calculate bulk density. Samples were air dried and sieved to 2 mm. These samples were collected in the main MpL of the four sections and were used for indirect estimation of saturated hydraulic conductivity (Ksc).
TABLE 1
| Section | MpL | No samples |
|---|---|---|
| 1 | Recreational arboreal plain | 9 |
| Plain with anthropic mounds | 18 | |
| Castle slope | 2 | |
| 2 | Recreational use plain | 3 |
| Diverse vegetation plain | 3 | |
| 3 | Plateau | 10 |
| Hillslopes | 9 | |
| 4 | Plateau | 4 |
| Hillslopes | 4 | |
| Total | 62 |
Sampling sites (0–5 cm) in the four sections of Chapultepec Park.
Soil Carbon Analysis
Carbon content (%) analysis was performed using a CNHS Perkin Elmer 2400 elemental analyzer at a combustion temperature of 975°C and a reduction temperature of 640°C, following the procedure described in .
To determine the carbon sequestration potential of each soil horizon, the organic carbon content per hectare (Mg ha-1) was calculated as follows Equation 1:
Finally, the carbon sequestration of the entire park was calculated over an area obtained by subtracting the sealed area reported in from the total area of the park.
Bulk density (g cm3) was calculated using the following formula:
Texture was determined using the pipette method according (Van Reeuwijk, 2002).
Soil Water Infiltration
In each MpL, soil infiltration capacity and infiltration water volume were evaluated. These analyses had three stages: i) determination of the field saturated hydraulic conductivity (Ks, mm h-1); ii) analysis of the rainfall intensity (mm h-1) and precipitation data (mm); and iii) analysis of the infiltration capacity obtained from the observation and comparison of the two previous points.
A double ring infiltrometer was used for direct measurement of saturated hydraulic conductivity (Ksm). Three samples were taken around each soil profile (N = 24) and the indirect estimate (Ksc) was calculated using pedotransfer functions (PTFs). Both measured and calculated values of soil saturated hydraulic conductivity (mm h-1) were averaged per MpL and per section.
PTFs use readily measured soil properties to derive those that are less easily determined (Wagenet et al., 1991); soil hydraulic properties are the most commonly estimated using this method (). Here, Ksc was derived from the properties of soil samples (N = 62) collected from the surface horizons of the profiles and from the 0–5 cm samples and measured in the laboratory. The parameters used in the PTF were organic matter (%), clay (%) and sand (%) content from 0 to 5 cm (). The authors provide a continuous pedotransfer function for predicting saturated hydraulic conductivity. According to the authors, the PTFs have been calibrated for different land uses and lithological types.
Rainfall Intensity and Precipitation Data
The analysis used data from the Tacubaya station (19°24′13″N; 99°11′46″ W, 2308.6 m.a.s.l.) from 2006 to 2019 National Meteorological Service database1. Rainfall intensity (mm/h) and rainfall amount (mm) data were grouped according to the maximum value per day (00:50 to 23:50 h), month and year. Since the data for 2010 were incomplete, the study was limited to the periods from 2006 to 2009 and from 2011 to 2012, during which at least 80% of the daily, monthly and yearly values were available.
The annual days on which the values of maximum rain intensity exceeded those of Ksc and Ksm were expressed as a percentage (%) of the total number of rainy days in that year. For each MpL and site, the percentage of days with values higher than the Ks values would indicate the moments when water drained or flooded due to soil saturation. Likewise, the infiltration water sheet (mm) was estimated based on the precipitation recorded at the Tacubaya station from 2009 to 2012, without considering 2010 because the database was not complete.
The maximum rain intensity (mm/h) of each rainy day and the values of Ksc and Ksm (mm/h) were plotted; finally, Ksm was plotted only when the values were close to those of rain intensity.
Estimation of Infiltration Water Regulation as a Soil Based Ecosystem Service at Chapultepec Park
Using the values obtained from the infiltration capacity, the volume of infiltrating water in each MpL was estimated in each of the four sections of the park. The volume of water that would have been prevented from infiltrating by sealing the soil was also taken into account. For this purpose, the annual precipitation values (m) obtained for each MpL were multiplied by the corresponding total surface area of that MpL (m2) to obtain the total potential volume of infiltration (m3, equivalent to 1000 L). To obtain the volume of water prevented from infiltration by soil sealing, the annual precipitation amount (m) obtained for each MpL was multiplied by the corresponding sealed area (m2) (). The effective volume of infiltration water was estimated from the difference between the potential total and the volume prevented by soil sealing.
Results
Morpho-Pedological Landscapes (MpL)
The preliminary morpho-pedological map divided the park into 6 MpL. Incorporation of more precise information on vegetation, intensity of use and soil degradation increases this to 12 MpL. The characteristics of the MpL and their location are shown in Table 2 and Figure 2.
TABLE 2
| Section I | ||||
|---|---|---|---|---|
| MpL | Area (ha) | Vegetation | Soil degradation | Symbol |
| Castle slope | 12.55 | Casuarina equisetifolia, Ligustrum sp., Quercus sp. | Microrelief, pedestals |  |
| Diverse vegetation plain | 54.91 | Ligustrum sp., Phytolaca dioica, grasses | Compaction, runoff flows, sealing |  |
| Recreational arboreal plain | 36.55 | Fraxinus sp., Ligustrum sp. | Compaction, rills, exposed tree roots, sealing |  |
| Plain with anthropic mounds | 158.91 | Fraxinus sp., Ligustrum sp . on grass | Compaction, runoff flows, sealing |  |
| Section II | ||||
|---|---|---|---|---|
| MpL | Area | Vegetation‐Use | Soil degradation | Symbol |
| Recreational use plain | 66.51 | Fraxinus sp., Ligustrum sp. On grass | Runoff flows, exposed tree roots on bare soils, sealing, compaction |  |
| Diverse vegetation plain | 87.04 | Cupressus lusitanica, Schinus molle, Eucalyptus spp., Ligustrum sp. and turf | Microrelief on bare soils, sealing, compaction |  |
| Section III | ||||
| MpL | Area | Vegetation‐Use | Soil degradation | Symbol |
|---|---|---|---|---|
| Hillslope south-west | 137.45 | Eucalyptus spp., Fraxinus spp. | Runoff flows, exposed tree roots |  |
| Hillslope north-east | 143.48 | Eucalyptus spp., Cupressus lusitanica | Runoff flows, exposed tree roots, rills |  |
| Plateau | 38.38 | Eucalyptus spp., Cupressus lusitanica, Buddleja cordata, Cotoneaster spp., Muhlenbergia spp | Microrelief, pedestals |  |
| Alluvial terrace | 2.08 | Fraxinus spp., Ligustrum sp., Cotoneaster spp., | Not visible | nd |
| Section IV | ||||
| MpL | Area | Vegetation‐Use | Soil degradation | Symbol |
|---|---|---|---|---|
| Hillslope south west | 70.21 | Eucalyptus spp., Cupressus lusitanica, Fraxinus spp | Runoff flows, exposed tree roots |  |
| Plateau | 29.51 | Induced grasslands | Microrelief, pedestals |  |
| Hillslopes barrilaco (west) | 12.42 | Eucalyptus spp., Cupressus lusitanica, Fraxinus spp., Buddleja cordata | Not visible |  |
Morphopedological landscape (MpL) characteristics in the four sections of Chapultepec Park.
FIGURE 2
As a result of the various reforestation programs, the dominant tree vegetation in the four sections of the park is fairly homogeneous, with a predominance of Fraxinus spp, Ligustrum sp, Eucalyptus sp and Cupressus lusitanica.
On the other hand, in the first two sections, where most of the visitors are concentrated, there are more widespread degradation features in the form of sealing and compaction, while on the slopes of sections III and IV, with slopes of 15° to 45°, runoff, rills and exposed tree roots are the most common forms of erosion.
Soil Survey
The soils in section I developed on construction waste, are superficial (Table 3), with high bulk density values a slightly acid pH and layers of anthropic fragments (brick layer).
TABLE 3
| MpL (soil profile) | Horizon | Depth (cm) | pH | Bulk density (g/cm3) | Texture | Organic C (%) | Structure | Rocks fragments | Porosity | Photo profile |
|---|---|---|---|---|---|---|---|---|---|---|
| Plain with anthropic mounds with Urbic Technosol (1) | Ah | 0–6 | 6.6 | 1.4 | Loam | 4.6 | Fine to medium subangular | 3% medium gravel | Fine and common vesiculars | 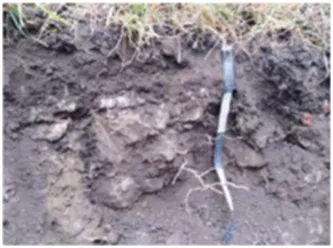 |
| Cw1 | 6–32 | 6.6 | 1.8 | Sandy loam | 0.7 | Medium Subangular | 35% medium gravel | Medium channels, few and fine vesiculars | ||
| Brick layer | ||||||||||
| Cw2 | 32–62 | 6.8 | 1.4 | Clay loam | 0.6 | Coarse subangular | 5% fine gravel | Many and fine vesiculars | ||
Soil Profile Characteristics in MpL Plain with anthropic mounds (Section I).
Soils in section II are very shallow (Table 4). Below 8–13 cm are two horizons with very high stoniness (>60%) mixed with anthropic fragments (of various ages).
TABLE 4
| MpL (soil profile) | Horizon | Depth (cm) | pH | Bulk density (g/cm3) | Texture | Organic C (%) | Structure | Rocks fragment | Porosity | Photo profile |
|---|---|---|---|---|---|---|---|---|---|---|
| Diverse vegetation plain with Leptic Urbic Technosol (2) | Ah | 0–8/13 | 6.9 | 1.4 | Silt loam | 5.0 | Medium and weak subangular | 0% | Fine and common vesiculars | 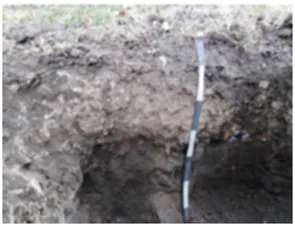 |
| C1 | 8/13–30/37 | 6.7 | n.d | Sandy clay loam | 0.9 | Medium and weak Subangular | 80% medium gravel (anthropic material) | Fine and few vesiculars | ||
| C2 | 30/37–43 | 6.0 | n.d | Sandy clay loam | n.d | Medium and weak subangular | 60% medium gravel (anthropic material) | Few vesiculars |
Soil Profile Characteristics in MpL Diverse vegetation plain (Section II).
The soils on the slopes of Section III (Table 5) were formed on volcanic ash and have diverse characteristics. The southeastern slopes have shallow soils (34 cm) with loam to silty loam textures, low bulk densities, and decreasing SOC contents. The soils of the northeastern slopes are deeper (60 cm), with a slightly clayey texture, medium bulk density, and increasing carbon content in the second horizon. The soils of the plateau are shallower, with a more acidic pH, a slightly more clayey texture and a high carbon content in the first horizon.
TABLE 5
| MpL (soil profile) | Horizon | Depth (cm) | pH | Bulk density (g/cm3) | Texture | Organic C (%) | Structure | Rocks fragment | Porosity | Photo profile |
|---|---|---|---|---|---|---|---|---|---|---|
| Hillslope south-west with Akroskeletic Cambic Phaeozem (3) | Ah1 | 0–10 | 6.4 | 1 | Loam | 8 | Fine to medium subagular | 1% fine gravel | Medium and fine interstitial | 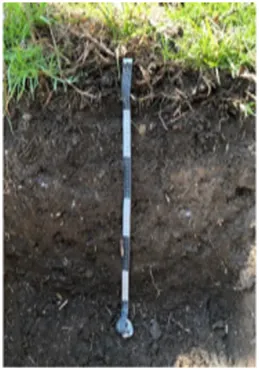 |
| Bw | 10–20 | 6.3 | 1 | Silt clay loam | 5.3 | Fine to medium subagular | 2% fine gravel | Medium and fine interstitial | ||
| BC | 20–34 | 5.4 | 1 | Silt clay loam | 4.3 | Medium subangular | 10% fine gravel | Many interstitial and few channels | ||
| C | 34–55 | 6.1 | 1.6 | Silt loam | 4.5 | -- | 90% medium gravel | -- | ||
| Hillslope norht-east with Luvic Phaeozem (4) | Ah1 | 0–8/10 | 6.4 | 1.3 | Silt clay loam | 6.9 | Fine subangular | 0% | Many and medium vesicular | 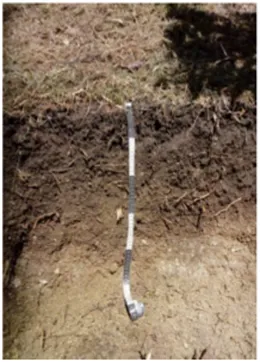 |
| Ah2 | 8/10–16 | 6.3 | 1.4 | Silt clay loam | 10.3 | Medium subangular | 0% | Common interstitial | ||
| Bw | 16–22 | 6.2 | 1.4 | Clay loam | 2.8 | Fine to Medium subangular | 1% fine gravel | Fine and common vesiculars | ||
| Bt | 22–60 | 6.2 | 1.5 | Silty clay | - | Coarse subangular | 1% fine gravel | Fine and few vesiculars | ||
| Plateau Eutric Leptosol (5) | Ah1 | 0–8 | 5.3 | 1.2 | Clay loam | 9.6 | Cloddy and coarse subangular | 0 | Fine and common vesiculars | 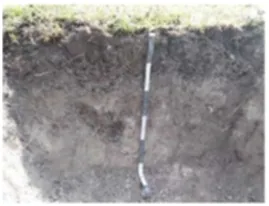 |
| Bw | 8–18 | 5.9 | 1.4 | Sandy clay | 2.3 | Fine and coarse subangular | 0 | Fine and common vesiculars and channels | ||
| C1 | 18–30 | - | - | Clay loam | - | - | 90% | - | ||
| C2 | 30–40 | - | - | - | - | - | 100% | - |
Soil profile characteristics in MpL of Section III.
The soils in Section IV occur on a plateau and on two types of slopes (Table 6). On the plateau, the soils are moderately deep, with moderate bulk density and little stoniness, while the soil on one of the slopes (SW) is shallow (29 cm), with a silty to loamy clay texture, moderate carbon content, and very little stoniness. The soil of the Barrilaco slope (NW) is deep and developed. It is the only soil that has a mulch layer, which is reflected in a high carbon content in the first horizon that descends along the profile. It has very little stoniness.
TABLE 6
| MpL (soil profile) | Horizon | Depth (cm) | pH | Bulk density (g/cm3) | Texture | Organic C (%) | Structure | Rocks fragment | Porosity | Photo profile |
|---|---|---|---|---|---|---|---|---|---|---|
| Plateau with Haplic Phaeozem (6) | Ah1 | 0–2 | 6.4 | 1.1 | Silt clay loam | 0.2 | Fine subangular and single grain | 0% | Many interstitial, medium channels | 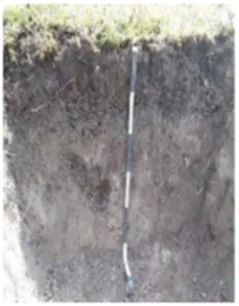 |
| AB | 2–13/15 | 7.3 | 1.2 | Clay loam | 7.9 | Medium and coarse subangular | 1% | Many interstitial, fine channels | ||
| CB1 | 13/15–28 | 6.3 | 1.2 | Silty loam | 0.4 | Medium and fine subangular | 2% | Many fine interstitial | ||
| CB2 | 28–53 | 1.2 | Silty loam | - | Medium and fine subangular | 3% | Common interstitial | |||
| Hillslope SW with Eutric, Mollic, Leptosol (7) | Ah | 0–6.5 | 6.6 | 1.2 | Silty loam | 5.2 | Medium subangular | 3% | Many fine interstitial, common tubulars | 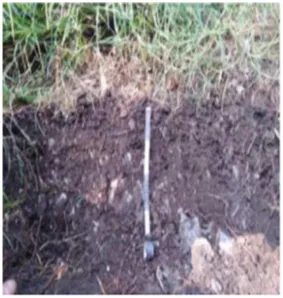 |
| Bw | 6.5–14/29 | 6.5 | 1.2 | Clay loam | 5.4 | Medium and fine subangular | 10% | Many fine interstitial, common tubulars | ||
| Hillslope Barrilaco with Eutric Cambisol (8) | O | 7–0 | decomposing eucalyptus leaves | 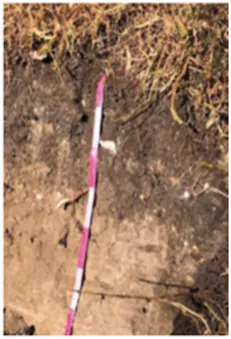 | ||||||
| Ah1 | 0–14 | 6.3 | 0.9 | Sandy loam | 10.4 | Medium and fine subangular | 1% gravel | Many fine interstitial, common tubulars | ||
| Ah2 | 14–25 | 6.6 | 1.0 | Clay loam | 3.8 | Coarse subangular | 4% gravel | Many fine interstitial, common fine tubulars | ||
| AB | 25–30 | 6.6 | 1.2 | Clay loam | 2.6 | Medium subangular | 3%gravel | Common interstitial, Medium tubulars | ||
| BC | 30–62 | 6.7 | 1.3 | Sandy clay | 0.7 | Coarse subangular | 3%gravel | Many fine interstitial | ||
Soil profile characteristics in MpL of Section IV.
Soil Organic Content and Storage Related Ecosystem Service
Soils retain C throughout the depth of the soil profile. The range of potential C stocks varies from 93 to 215.8 Mg ha-1. The soils of the subsurface horizons of Chapultepec Park had a lower organic carbon content per unit volume than the surface samples (Table 7). However, as the thickness of the lower horizons increases, so does the carbon content, especially in phaeozem (III) and leptosol (IV). The average SOC sequestration in the subsurface horizons is 157 MgC ha-1 ±65.4.
TABLE 7
| Section | MpL (soil profile) | Horizon | Depth | Corg | Bulk density | SOC | Potential stock | Real stock | Loss |
|---|---|---|---|---|---|---|---|---|---|
| (cm) | % | g/cm3 | (Mg ha-1) | (Mg ha-1) | (Mg ha-1) | % | |||
| I | Plain with antropic mouths with Urbic Technosol (1) | 1Ah | 6 | 4.6 | 1.4 | 38.6 | 9,674 | 5,672 | 41.4 |
| 2CB | 26 | 0.7 | 1.8 | 32.7 | 8,202 | 4,808 | |||
| Bricks | |||||||||
| 3B(t) | 26 | 0.6 | 1.4 | 21.84 | 5,468 | 3,205 | |||
| Total | 93.1 | ||||||||
| II | Diverse vegetation plain with Leptic Urbic Technosol (2) | 1Ah | 10.5 | 5 | 1.4 | 73.5 | 11,285 | 5,735 | 49.2 |
| 2C | 23 | 0.9 | 1.6 | 33.12 | 5,085 | 2584 | |||
| 3C | 20 | ||||||||
| Total | 151.4 | ||||||||
| III | Hillslope South-west with Akroskeletic Cambic Phaeozem (3) | Ah | 10 | 8 | 1.0 | 80.0 | 22,956 | 19,747 | 14.0 |
| Bw | 24 | 4.9 | 1.0 | 117.6 | 33,746 | 29,028 | |||
| C | 21 | 4.5 | 1.6 | 151.2 | 43,388 | 37,325 | |||
| Total | 197.1 | ||||||||
| Hillslope North-east with Luvic Phaeozem (4) | Ah1 | 9 | 6.9 | 1.3 | 80.7 | 23,166 | 19,927 | 14.0 | |
| Ah2 | 7 | 10.3 | 1.4 | 100.9 | 28,965 | 24,916 | |||
| B | 6 | 2.8 | 1.4 | 23.5 | 6,749 | 5,805 | |||
| Bt | 38 | - | 1.5 | ||||||
| Total | 205.1 | ||||||||
| Plateau Eutric Leptosol (5) | Ah | 8 | 9.6 | 1.2 | 92.1 | 3,537 | 3,058 | 13.5 | |
| B | 10 | 2.3 | 1.4 | 32.2 | 1,235 | 1,068 | |||
| Rw1 | 12 | - | - | ||||||
| Total | 124.3 | ||||||||
| IV | Plateau with Haplic Phaeozem (6) | Ah | 2 | n.d | |||||
| AB | 12 | 7.9 | 1.2 | 113.7 | 3,357.0 | 1779.2 | 47.0 | ||
| CB1 | 14 | 0.4 | 1.2 | 6.7 | 198.3 | 105.1 | |||
| CB2 | 10 | -- | 1.2 | ||||||
| Total | 120.4 | ||||||||
| Hillslope SW with Eutric, Mollic, Leptosol (7) | Ah | 6.5 | 5.2 | 1 | 33.8 | 2372 | 2029 | 14.5 | |
| AB | 7.5/22.5 | 5.4 | 1.2 | 123.1 | 8,643 | 7,392 | |||
| Total | 127.7 | ||||||||
| Hillslopes Barrilaco with Eutric Cambisol (8) | O | 7 | eucalyptus leaves | ||||||
| Ah1 | 14 | 10.4 | 1 | 145.6 | 3,995 | not sealed | |||
| Ah2 | 11 | 3.8 | 1.2 | 50.1 | 1,376 | ||||
| AB | 5 | 2.6 | 1.2 | 15.6 | 428 | ||||
| Bw | 5 | 0.7 | 1.3 | 4.5 | 124 | ||||
| Total | 215.8 | ||||||||
Amount of soil organic carbon (SOC) present in each of the horizons of the 8 profiles described in the Chapultepec park.
Numbers in bold correspond to totals.
SOC stocks were higher in Cambisols and Phaeozems than in Technosols and Leptosols. We found a trend in the concentration of SOC that is presented as: hillslope Barrilaco > hillslope NE > hillslope SW. On the other hand, Plateau with Leptosol and Phaezoem have similar SOC stocks. The lowest SOC values were found in the Technosols.
In Technosols and Leptosols, the SOC stock was higher in the upper horizon (Ah) (except in Hillslope SW of the third section). In phaeozems, SOC was higher in the lower horizons, Ah2, AB and Bw (Figure 3).
FIGURE 3
SOC content was lower in grass-dominated MpLs, such as the Diverse vegetation plain (section II), than on slopes with mixed vegetation.
The detrimental effect of surface sealing was evident in sections with more construction, such as sections I and II, where the potential for SOC retention was reduced by 40%–50%, while in section III the loss of C retention was around 14% and in section IV it varied between 14% and 47%.
Water Infiltration and Its Regulation by Soils in the MpL
For all MpL, the value of saturated soil hydraulic conductivity (Ksc) calculated from the PTFs was significantly lower than the Ksm measured with the double ring infiltrometer, and the former have more variability than those measured with the PTF (Table 8).
TABLE 8
| Section | MpL | Ksc (mm/h) | Ksm (mm/h) | ||||||
|---|---|---|---|---|---|---|---|---|---|
| Average | Mín | Max | n | Average | Mín | Max | n | ||
| I | Castle slope | 25.6 | - | - | 1 | - | - | - | - |
| Recreational arboreal plain | 21.7 | 16.4 | 24.4 | 6 | 75 | 60 | 120 | 4 | |
| Diverse vegetation plain | 25.5 | 18.7 | 38.1 | 22 | 86 | 30 | 180 | 15 | |
| Plain with anthropic mounds | 24.3 | 24.2 | 24.4 | 3 | 160 | 120 | 180 | 3 | |
| II | Recreational use plain | 27.7 | 22.3 | 32.5 | 3 | 60 | 60 | 60 | 1 |
| Diverse vegetation plain | 32.9 | 29.6 | 36.7 | 3 | 140 | 120 | 180 | 3 | |
| III | PLareau | 18.1 | 12.4 | 21.5 | 6 | - | - | - | - |
| Alluvial terrace | 22.4 | 19.6 | 27.2 | 3 | - | - | - | - | |
| Hillslopes | 27.5 | 19 | 40.1 | 11 | 164.7 | 28 | 480 | 6 | |
| IV | Plateau | 17.4 | 17.3 | 17.4 | 2 | - | - | - | - |
| Hillslopes | 25.5 | 20.7 | 30.3 | 2 | - | - | - | - | |
Average, minimal and maximal Ksc and Ksm values obtained per MpL for each Chapultepec park section. Ksm:measured hydraulic conductivity, Ksc: calculated hydraulic conductivity, n: number of observations.
In all sections, the Ksm values were higher than the reported maximum rainfall intensity. In Section I, the Ksm values, infiltration in these MpLs was estimated to be 100%, corresponding to 4,948.0 mm of rain for the periods 2006–2009 and 2011–2012 (Figure 4). The lowest Ksc was for the Recreational Arboreal Plain (21.7 mm/h) and the highest was 25.6 mm/h on the Castle Slope. This calculated value of 25.6 mm/h was exceeded six times by measured rainfall events, of which an estimated 99.1% (4,907.7 mm) infiltrated into the ground and the remaining 0.9% (40.3 mm) ran off.
FIGURE 4
In Section II, Ksm values were even higher than the reported maximum rainfall intensity (55.6 mm/h), with 60.0 mm/h for the recreational use plain and 140.0 mm/h for the Diverse vegetation plain (Figure 4). Infiltration was estimated to be 100% (4,948.0 mm) for these MpLs.
In section III, the highest Ksc value was for the hillslope (27.5 mm/h) (Figure 4), which gave an estimate of 98.9% infiltration. The lowest Ksc (18.1 mm/h) was for the plateau and gave an estimate of 96.9% (4,790.5 mm) infiltration. Therefore, this was the MpL with the most runoff: 3.1% (157.5 mm).
Finally, in section IV (Figure 4), a Ksc value of 25.5 mm/h for the Hillslopes suggested an infiltration of 98.9% (4,893.5 mm), with 1.1% of the rain being drained or flooded.)
By comparing the distribution and central tendency of the hydraulic conductivity values for each evaluated MpL (Figure 5), it was determined whether land use affected the infiltration capacity of the soil.
FIGURE 5
In Sections I and II, there was no significant difference in Ksc values between MpLs, although Ksc was higher for the Diverse Vegetation Plain than for the Recreational Arboreal Plain. In section III, the value was significantly higher (p = 0.004) for the hillslopes than for the plateau. In Section IV, a slightly higher Ksc in the Hillslopes was not significant.
The lack of statistically significant differences precluded any conclusions about the effect of land use on infiltration capacity. Nevertheless, the Recreational Arboreal Plain had a slightly lower infiltration capacity than any other MpL in Sections I and II. In Section I (Figure 6), the Ksc values suggested that the greatest volume of infiltration per MpL during the study (∼4,549 thousand m3) had occurred in the Diverse vegetation plain; within the section, this was the MpL with the most extensive surface area but with 41.5% of it sealed so that the volume of runoff (∼3,227.2 thousand m3) was also the greatest.
FIGURE 6
In section II (Figure 6), 36.9% of the surface of the Diverse Vegetation Plain was sealed, while in the Recreational Arboreal Plain 65.2% was sealed. Nevertheless, the Ksc values indicated that the Diverse Vegetation Plain (Ksc 32.9 mm/h) had the greater volume of infiltrating water during the study period (2710.4 thousand m3), with 1,585.2 thousand m3 of runoff. For the Recreational arboreal plain (Ksc 27.7 mm/h), the estimates were 1,129.3 thousand m3 of infiltration water and 2119.5 thousand m3 of runoff.
In Section III (Figure 6), the Ksc values indicated that the Hillslopes had the highest volume of infiltration water (12,079.0 thousand m3) and the highest volume of runoff (1963.3 thousand m3) during the study period. For the plateau, the estimated infiltration volume was 1,589.5 thousand m3 and the runoff volume was 249.1 thousand m3. For the alluvial terraces, the estimated infiltration was 97.8 thousand m3 and the runoff was 3.4 thousand m3.
In Section IV (Figure 6), the MpL hillslopes had 14.5% of its total area sealed; Ksc values suggested that the volume of infiltration water had been 12,079.0 thousand m3 and runoff had been 497.2 481 thousand m3 (Figure 6). For the Plateau, with 47% of its total surface sealed, the estimates were 747.6 thousand m3 of infiltration water and a relatively high volume of runoff because of sealing (663.0 thousand m3).
Discussion
In heterogeneous environments such as urban parks, where natural and anthropic processes interact, soil survey requires methods that allow the unification of soil-forming factors, while disentangling the complex spatial patterns of soils (). As an urban green space it was also important to consider the intensity of use and its impact on soil erosion. The integration of these factors into morphoedaphological units has allowed us to stratify the landscape, creating homogeneous and representative areas for sampling.
SOC storage and depth distribution are influenced by environmental conditions such as climate, vegetation, and land use, as well as by soil management in urban areas (). In Chapultepec Park, SOC stocks were higher in Cambisols (197 Mg ha-1) and Phaeozems (205 Mg ha-1) than in Technosols (93–151 Mg ha-1) and Leptosols (124–127 Mg ha-1) in subsurface horizons and in general. The role of vegetation was crucial, as the SOC content was higher in the mixed vegetation than in the grassland-only area. Because vegetation community structure may affect the size of the SOC pool by altering both the microenvironment and soil characteristics (You et al., 2014). Also trees can impact the characteristics of the soil beneath them, with various species influencing factors such as soil pH, carbon (C) and nitrogen (N) content, as well as altering the composition of microbial communities ().
These results support previous reports that SOC is higher under mixed vegetation than under grass (Takahashi et al., 2008) and also that mixed forest stands are better for storing SOM (Zhou et al., 2020).
The highest SOC content is found in the first 20 cm of soil, with the exception of Phaeozem (III) and Leptosol (IV), where the greater thickness of the subsurface horizons increases the C. Results are similar to Swift (2001) and Rumpel and Kögel-Knabner (2011), who mention that more than 50% of the SOC reserves are found in subsurface horizons below 30 cm depth.
Compared to the SOC sequestration potential of temperate forest soils in Mexico (327 Mg ha−1) (), which could be equivalent to the native vegetation of Chapultepec Park, Chapultepec soils have 28%–62% of this potential. The difference could be explained by the presence of exotic vegetation, intensive use and management practices. Also in a initial study, quantified a reservoir of 3,067.4 Mg ha−1 C in the first section of Chapultepec Park. However, this previous study may have underestimated C sinks because it included plants but excluded soils.
There is no standardized method to describe and characterize urban soils, especially in terms of sampling depth, and even the formula to calculate SOCS is not harmonized, which limits the ability to compare results between urban parks (). However, a global average SOC content of 127 Mg ha-1 has been reported in urban soils, with a very high variability of values within each city, ranging from 3 to 1,348 Mg ha-1 (Scharenbroch, et al., 2017), which is consistent with what was found in Chapultepec Park.
A recent review by Vasenev and Kuzyakov (2018) found that SOC content in urban soils can be higher than in natural soils and, combined with C accumulation through the soil profile to 100 cm, resulted in total C stocks 3–5 times higher than in natural soils. Similarly, urban park soils in Milan were found to have higher SOC stocks (0–40 cm) than agricultural soils in the region and were comparable to other non-urban soils in the region ().This highlights the importance of urban soils and the need to limit their sealing and adopt practices that improve SOC retention in soils.
The distribution of SOC in the soils of Chapultepec is evidence of a natural in C dynamics, with little human intervention, unlike what mention for parks in NYC and Paris, which have suffered from interventions in the form of fertilization and irrigation.
For infiltration measurements, the comparison between field sampling and the use of PTF shows that the values of the first method are very homogeneous, despite the diversity of soils, which is a major weakness of this method, since it does not take into account several soil properties that determine infiltration. However, although the hydraulic conductivity of urban soils differs from that of other soils, there has been no comprehensive, consistent assessment of the hydraulic conductivity of urban soils (Shuster et al., 2021).
Vegetation type affects infiltration. The MpLs with the least disturbed vegetation have the highest hydraulic conductivity values. Living and decaying roots create a network of interconnected channels in the soil (macropores). Flow through these macropores can be up to several hundred times faster than flow through the soil matrix. Several studies have shown that vegetation cover significantly influences the hydrological response (; ). also found higher saturated hydraulic conductivity in areas of broadleaf forest and small woodland than in permanent pasture and cultivated land.
Sealing urban green spaces has a number of negative impacts. These include the inability to sequester carbon and allow infiltration (van der Putten et al., 2018; Scalenghe and Ajmone Marsan, 2009). In our study area, particularly in the first two sections, sealing reduces the ability to sequester carbon and allow infiltration by 40%–50%, thereby increasing runoff.
Urban planning can play an important role in supporting the implementation of NbS and in managing trade-offs and conflicts. However, it is well known that urban decision-makers and planners are often faced with conflicting or incomplete information about the effectiveness of urban parks, particularly their ability to provide a range of co-benefits (Jones et al., 2022).
In recent years, the Chapultepec: Nature and Culture has been implemented, investing nearly $600 million in infrastructure to increase connectivity within the park with bridges, walkways, and the construction of new museums and an art school2. This initiative demonstrates that gray infrastructure policies continue to dominate in the area of trade-offs, with little recognition of ecosystem services.
In this context, accurate information on the ecosystem services provided by soils becomes more relevant for better decision making, not only in the management of this urban park, but also in urban planning decisions.
Conclusion
This study proposes two methodological approaches for the analysis of urban park soils, which are characterized by the interaction of natural and anthropic processes. On the one hand, the importance of comprehensively capturing and analyzing soil-forming factors, land use and soil degradation processes in morpho-pedological landscapes. On the other hand, the advantage of using pedotransfer functions (PTFs) for the analysis of water infiltration, incorporating properties that determine this process, instead of direct measurement with a double ring infiltrometer.
To highlight the importance of soil ecosystem services in urban parks, SOC reserves and water infiltration were analyzed. This information would allow the establishment of a baseline for monitoring these services and provide information to decision makers and urban planners seeking to reduce the construction of gray infrastructure that seals soils and reduces their capacity to provide these ecosystem services.
We found that the SOC stock was higher in Cambisol and Phaeozem than in Technosols and Leptosols; other trends in SOC concentration were Hillslope SW > Hillslope NE > Hillslope Barrilaco >> Hillslopes in Leptosols > Plateau and Plains with Technosols. In Technosols and Leptosols, the SOC stock was higher in the upper horizon (Ah) (except the hillslopes above Leptosols in section 4). In phaeozems, the SOC stock was higher in the lower horizons, Bw or Cw. Especially in Phaeozem, SOC (%) increased at 10–20 cm depth.
SOC retention in the subsurface horizons was similar to that of natural forests. The role of vegetation was crucial, as the SOC content was higher in the mixed vegetation than under grass. However, the sealing of soils for construction reduces the chances of SOC retention by as much as 40%–50% in the first two sections of the park.
Despite the diversity of soils and vegetation, Ksm values are highly homogeneous, while values calculated using PTFs better reflect this heterogeneity.
Between 2006 and 2012, only a few annual precipitation events exceeded Ksc values in all MpLs, suggesting that the soils of Chapultepec Park infiltrate the most precipitation.
Although the intensity of use of some MpLs, such as the Recreational Arboreal Plain in Sections I and II, compacts the soils and reduces their macroporosity, which influences the low hydraulic conductivity values, one of the main determinants of increased runoff is surface sealing.
The results show that the soils of Chapultepec Park play an important role in capturing C and infiltrating most of the rainfall. The conservation of this park - decreasing sealed areas - will be vital for the sustainability of Mexico City.
Statements
Data availability statement
The original contributions presented in the study are included in the article/Supplementary Material, further inquiries can be directed to the corresponding author.
Author contributions
HC and SC participated in the design and implementation of the study. HC delineated the morphopedological landscapes and participated in the interpretation of soil profiles. SC analyzed the organic soil carbon results. BP implemented the pedotransfer functions and did the hydraulic conductivity calculations. VP participated in the reading of soil profiles and their description. LL helped with data analysis. All authors contributed to the article and approved the submitted version.
Funding
The author(s) declare that financial support was received for the research, authorship, and/or publication of this article. The authors are grateful for funding from CONACyT (grant number 302917). CONACYT project CF-2023-I-1846 partially paid for the publication.
Acknowledgments
The authors acknowledge that a preprint of a first version of this article exists: (). The authors would like to thank the anonymous reviewers for their suggestions and feedback. Students Luis Raziel, Ruben Anderson, Karla Toribio, Daniela Rodriguez, Jessica Morales, Paola Velázquez, Violeta E. Cardona and Karla A. del Valle participated enthusiastically in the fieldwork.
Conflict of interest
The authors declare that the research was conducted in the absence of any commercial or financial relationships that could be construed as a potential conflict of interest.
Supplementary material
The Supplementary Material for this article can be found online at: https://www.frontierspartnerships.org/articles/10.3389/sjss.2024.13398/full#supplementary-material
Footnotes
1.^https://smn.conagua.gob.mx/es/observatorio-tacubaya
2.^https://www.obras.cdmx.gob.mx/proyectos/complejo-cultura-bosque-de-chapultepec
References
1
Ayala-AzcarragaC.DiazD.FernandezT.Cordova-TapiaF.ZambranoL. (2023). Uneven Distribution of Urban Green Spaces in Relation to Marginalization in Mexico City. Sustainability15, 12652. 10.3390/su151612652
2
BaiX.DawsonR. J.Ürge-VorsatzD.DelgadoG. C.BarauA. S.DhakalS.et al (2018). Six Research Priorities for Cities and Climate Change. Nature555, 23–25. 10.1038/d41586-018-02409-z
3
BaveyeP. C.BaveyeJ.GowdyJ. (2016). Soil “Ecosystem” Services and Natural Capital: Critical Appraisal of Research on Uncertain Ground. Front. Environ. Sci.4, 41. 10.3389/fenvs.2016.00041
4
BertramK. R.RehdanzK. (2015). The Role of Urban Green Space for Human Well-Being. Ecol. Econ.120, 139–152. 10.1016/j.ecolecon.2015.10.013con.2015.10.013
5
BhaduriB.MinnerM.TatalovichS.HarborJ. (2001). Long-Term Hydrologic Impact of Urbanization: A Tale of Two Models. J. Water Resour. Plan. Manag.555, 13–19. 10.1061/(ASCE)0733-9496(2001)127:1(13)
6
BlanchartA.SéréG.JohanChGillesW.StasM.ConsalèsJ.et al (2018). Towards an Operational Methodology to Optimize Ecosystem Services provided by Urban Soils. Landsc. Urban Plan.176, 19. 10.1016/j.landurbplan.2018.03.019
7
BoschJ. M.HewlettJ. D. (1982). A Review of Catchment Experiments to Determine the Effect of Vegetation Changes on Water Yield and Evapotranspiration. J. Hydrology55 (1-4), 3–23. 10.1016/0022-1694(82)90117-2
8
CambouA.ShawR. K.HuotH.Vidal-BeaudetL.HunaultG.CannavoP.et al (2018). Estimation of Soil Organic Carbon Stocks of Two Cities, New York City and Paris. Sci. total Environ.644, 452–464. 10.1016/j.scitotenv.2018.06.322
9
CanedoliC.FerreC.Abu El KhairD.Padoa-SchioppaE.ComolliR. (2020). Soil Organic Carbon Stock in Different Urban Land Uses: High Stock Evidence in Urban Parks. Urban Ecosyst.23 (1), 159–171. 10.1007/s11252-019-00901-6
10
ChallengerA.CordovaA.LazosE.EquihuaM.MaassM. (2018). Opportunities and Obstacles to Socioecosystem Based Environmental Policy in Mexico: Expert Opinion at the Science-Policy Interface. Ecol. Soc.23 (2), 31. 10.5751/ES-10066-230231
11
CotlerH.CramS.Mendoza RuizL.Ramírez BeltránM. N. (2021). Soil Sealing in Chapultepec Forest and Restoration Proposals. Investig. Geográficas, 105. 10.14350/rig.60393
12
CotlerH.CramS.PradoB.PeñaV. (2023). Soil ecosystem services of an urban park in Mexico as a basis for planning. Research Square. 10.21203/rs.3.rs-3054818/v1
13
DelbecqueN.DondeyneS.GelaudeF.MouazenA.VermeirP.VerdoodtA. (2022). Urban Soil Properties Distinguished by Parent Material, Land Use, Time Since Urbanization, and Pre-urban Geomorphology. Geoderma413, 115719. 10.1016/j.geoderma.2022.115719
14
FerrerJ. M.MonrealE.Sánchez del Corral JiménezA.García MeléndezE. (2004). Constructing a Saturated Hydraulic Conductivity Map of Spain Using Pedotransfer Functions and Spatial Prediction. Geoderma23, 257–277. 10.1016/j.geoderma.2004.02.011
15
FrantzeskakiN.McPhearsonT.CollierM. J.KendalD.BulkeleyH.DumitruA.et al (2019). Nature-Based Solutions for Urban Climate Change Adaptation: Linking Science, Policy, and Practice Communities for Evidence-Based Decision-Making. Bioscience69 (6), 455–466. 10.1093/biosci/biz042
16
FuchsJ.Riffo-PérezR.PradoL. (2017). Desarrollo sostenible, urbanización y desigualdad en América Latina y el Caribe: dinámica y desafíos para el cambio estructural. Chile: CEPAL. Available at: https://www.cepal.org/es/publicaciones/42141-desarrollo-sostenible-urbanizacion-desigualdad-america-latina-caribe-dinamicas.
17
GáborP.JombachS.OngjerthR. T. (2009). The Relation Between the Biological Activity and the Land Surface Temperature in Budapest. Appl. Ecol. Environ. Res.7, 241–251. 10.15666/aeer/0703_241251
18
GallartF.LlorensP. (2003). Catchment Management Under Environmental Change: Impact of Land Cover Change on Water Resources. Water Int.28 (3), 334–340. 10.1080/02508060308691707
19
Gobierno de la Ciudad de México (2017). Ley de Mitigación y adaptación al cambio climático y desarrollo sustentable. Available at: https://www.sedema.cdmx.gob.mx/storage/app/uploads/public/5a6/78d/e56/5a678de56e046431870792.pdf.
20
Gómez-DíazJ. D.Monterroso-RivasA.Tinoco-RuedaJ.Etchevers-BarraJ. (2012). Almacenes de carbono en el piso forestal de dos tipos de bosque. Terra Latinoam.30, 177–187.
21
Gonzalez-SosaE.BraudI.DehotinJ.LassabatereL.Angulo-JaramilloR.LagouyM.et al (2010). Impact of Land Use on the Hydraulic Properties of the Topsoil in a Small French Catchment. Hydrol. Process.24 (17), 2382–2399. 10.1002/hyp.7640
22
GrataniL.VaroneL.BonitoA. (2016). Carbon Sequestration of Four Urban Parks in Rome. Urban For. & Urban Green.19, 184–193. 10.1016/j.ufug.2016.07.007
23
HowardJ. (2021). Urban Anthropogenic Soils—A Review. Adv. Agron.165, 1–57. 10.1016/bs.agron.2020.08.001
24
JabbarM.Mohd YusoffM.ShafieA. (2022). Assessing the Role of Urban Green Spaces for Human Wellbeing: A Systematic Review. GeoJournal87, 4405–4423. 10.1007/s10708-021-10474-7
25
JenningsV.BamkoleO. (2019). The Relationship between Social Cohesion and Urban Green Space: An Avenue for Health Promotion. Int. J. Environ. Res. Public Health16 (3), 452. 10.3390/ijerph16030452
26
JonesL.ReisS.HutchinsM.MillerJ.HeB.Seifert-DähnB.et al (2022). Airsheds, watersheds and more -the flows that drive intra -extra urban connections, and their implications for nature-based solutios (NBS). Nature-Based Solutions2. 10.1016/j.nbsj.2022
27
KabischN.FrantzeskakiN.PauleitS.NaumannS.DavisM.ArtmannM.et al (2016). Nature-based Solutions to Climate Change Mitigation and Adaptation in Urban Areas: Perspectives on Indicators, Knowledge Gaps, Barriers, and Opportunities for ActionEcol. Soc.21:art39. 10.5751/ES-08373-210239
28
LiuC.LiX. (2012). Carbon Storage and Sequestration by Urban Forests in Shenyang, China. Urban For. & Urban Green.11, 121–128. 10.1016/j.ufug.2011.03.002
29
López-LópezS.Martínez-TrinidadT.Benavides-MezaH.García-NietoM.Ángeles-PérezG. (2018). Reservorios de biomasa y carbono en el arbolado de la primera sección del Bosque de Chapultepec, Ciudad de México. Madera Bosques24 (3), e2431620. 10.21829/myb.2018.2431620
30
MinasniB.Mc BratneyA. (2002). The Efficiency of Various Approaches to Obtaining Estimates of Soil Hydraulic Properties. Geoderma107 (1-2), 55–70. 10.1016/s0016-7061(01)00138-07061(01)00138-0
31
MitchellR. J.CampbellC. D.ChapmanS. J.CameronC. M. (2010). The Ecological Engineering Impact of a Single Tree Species on the Soil Microbial Community. J. Ecol.98, 50–61. 10.1111/j.1365-2745.2009.01601.x
32
MonrealC. M.EtcheversJ. D.AcostaM.HidalgoC.PadillaJ.LópezR. M.et al (2005). A Method for Measuring Above-And Below-Ground C Stocks in Hillside Landscapes. Can. J. Soil Sci.85, 523–530. 10.4141/S04-086
33
MoraL.ShimadaK. (2007). “Determinación de Carbono y Nitrógeno total,” in Procedimiento Estandarizado. Clave Met 002. Versión 1. Laboratorio de Edafología Ambiental, Instituto de Geología (Mexico: Universidad Nacional Autónoma de México).
34
O’RiordanR.DaviesJ.StevensC.QuintonJ. (2021). The Effects of Sealing on Urban Soil Carbon and Nutrients. Soil Discuss.7, 18. 10.5194/soil-2021-18
35
PUEC (Programa Universitario de Estudios sobre la Ciudad-UNAM) (2002). “Proyecto Ejecutivo para la Implementación del Manejo Integral y Desarrollo Autosostenible del Bosque de Chapultepec,” in Secretaría del Medio Ambiente. Ciudad de México.
36
RumpelC.Kögel-KnabnerI. (2011). Deep Soil Organic Matter—A Key but Poorly Understood Component of Terrestrial C Cycle. Plant Soil338, 143–158. 10.1007/s11104-010-0391-5
37
ScalengheR.Ajmone MarsanF. A. (2009). The Anthropogenic Sealing of Soils in Urban Areas. Landsc. Urban Plan.90, 1–10. 10.1016/j.landurbplan.2008.10.011durbplan.2008.10.011
38
ScharenbrochB.DayS.TrammellT.PouyatR. (2017). “Urban Soil Carbon Storage,” in Urban Soils. Editors LalR.StewartB. A. (Boca Raton: CRC Press).
39
SEDEMA (2024). Inventario de áreas verdes. Available at: https://sedema.cdmx.gob.mx/programas/programa/inventario-de-areas-verdes.
40
ShusterW. D.SchifmanL.KelleherC.GoldenH.BhaskarA. S.ParolariA. J.et al (2021). K in an Urban World: New Contexts for Hydraulic Conductivity. JAWRA J. Am. Water Resour. Assoc.57, 493–504. 10.1111/1752-1688.12918
41
SiebeC.ReinholdJ.StahrK. (2016). “Manual para la descripción y evaluación ecológica de suelos en el campo,” in Tercera Edición (Mexico: Universidad Nacional Autónoma de México).
42
Sowinska-SwierkoszB.GarcíaJ. (2022). What Are Nature-Based Solutions (NBS)? Setting Core Ideas for Concept Clarification. Nature-based solutions2, 100009. 10.1016/j.nbsj.2022.100009
43
SwiftR. S. (2001). Sequestration of Carbon by Soil. Soil Sci.166, 858–871. 10.1097/00010694-200111000-00010
44
TakahashiT.AmanoY.KuchimuraK.KobayashiT. (2008). Carbon Content of Soil in Urban Parks in Tokyo, Japan. Landsc. Ecol. Eng.4, 139–142. 10.1007/s11355-008-0043-6
45
UngaroF.CalzolariC.PistocchiA.MalucelliF. (2014). Modelling the Impact of Increasing Soil Sealing on Runoff Coefficients at Regional Scale: A Hydropedological Approach. J. Hydrology Hydromechanics62, 33–42. 10.2478/johh-2014-0005johh-2014-7010005702
46
USS Working Group WRB (2022). World Reference Base for Soil Resources. International Soil Classification System for Naming Soils and Creating Legends for Soil Maps. 4th ed. Vienna-Austria: International Union of Soil Sciences IUSS.
47
van der PuttenW.PoesenJ.LisáL.WindingA.MooraM.LemanceauP.et al (2018). Opportunities for Soil Sustainability in Europe. European Academies. Science Advisory Council. EASAC Policy Rep.
48
Van ReeuwijkL. P. (2002). “Procedures for Soil Analysis,” in International Soil Reference and Information Centre (Wageningen: ISRIC, FAO). Available at: https://www.isric.org/sites/default/files/ISRIC_TechPap09.pdf.
49
VasenevV.KuzyakovY. (2018). Urban Soils as Hot Spots of Anthropogenic Carbon Accumulation: Review of Stocks, Mechanisms and Driving Factors. Land Degrad. Dev.29 (6), 1607–1622. 10.1002/ldr.2944
50
WagenetR. J.BoumaJ.GrossmanR. B. (1991). Minimum Data Sets for Use of Soil Survey Information in Soil Interpretive Models. Soil Sci. Soc. Am. Special Publ.28, 161–182. 10.2136/sssaspecpub28.c10
51
World Health Organization (WHO) (2009). Urban Planning and Human Health in the European City, Report to the World Health Organisation. Int. Soc. City Regional Planners (ISOCARP).
52
YouY.WangJ.HuangX.TangZ.LiuS.SunO. J. (2014). Relating Microbial Community Structure to Functioning in Forest Soil Organic Carbon Transformation Andturnover. Ecol. Evol.4, 633–647. 10.1002/ece3.969
53
ZambranoL.Pacheco-MuñozR.FernándezT. (2017). A Spatial Model for Evaluating the Vulnerability of Water Management in Mexico city, Sao Paulo and Buenos Aires considering Climate Change. Anthropocene17, 1–12. 10.1016/j.ancene.2016.12.001
54
ZhouL.SunY.SaeedS.ZhangB.LuoM. (2020). The Difference of Soil Properties between Pure and Mixed Chinese Fir (Cunninghamia Lanceolata) Plantations Depends on Tree Species. Glob. Ecol. Conserv.22, e01009. 10.1016/j.gecco.2020.e01009
Summary
Keywords
morpho-pedological landscapes, saturated hydraulic conductivity, soil sealing, soil carbon sequestration, nature-based solution
Citation
Cotler H, Cram S, Prado B, Peña V and Lucio L (2024) Soil Ecosystem Services in Urban Parks as a Basis for Better Urban Planning: The Case of Mexico City. Span. J. Soil Sci. 14:13398. doi: 10.3389/sjss.2024.13398
Received
17 June 2024
Accepted
25 October 2024
Published
26 November 2024
Volume
14 - 2024
Edited by
Avelino Núñez-Delgado, University of Santiago de Compostela, Spain
Updates
Copyright
© 2024 Cotler, Cram, Prado, Peña and Lucio.
This is an open-access article distributed under the terms of the Creative Commons Attribution License (CC BY). The use, distribution or reproduction in other forums is permitted, provided the original author(s) and the copyright owner(s) are credited and that the original publication in this journal is cited, in accordance with accepted academic practice. No use, distribution or reproduction is permitted which does not comply with these terms.
*Correspondence: Helena Cotler, hcotler@centrogeo.edu.mx
Disclaimer
All claims expressed in this article are solely those of the authors and do not necessarily represent those of their affiliated organizations, or those of the publisher, the editors and the reviewers. Any product that may be evaluated in this article or claim that may be made by its manufacturer is not guaranteed or endorsed by the publisher.