Abstract
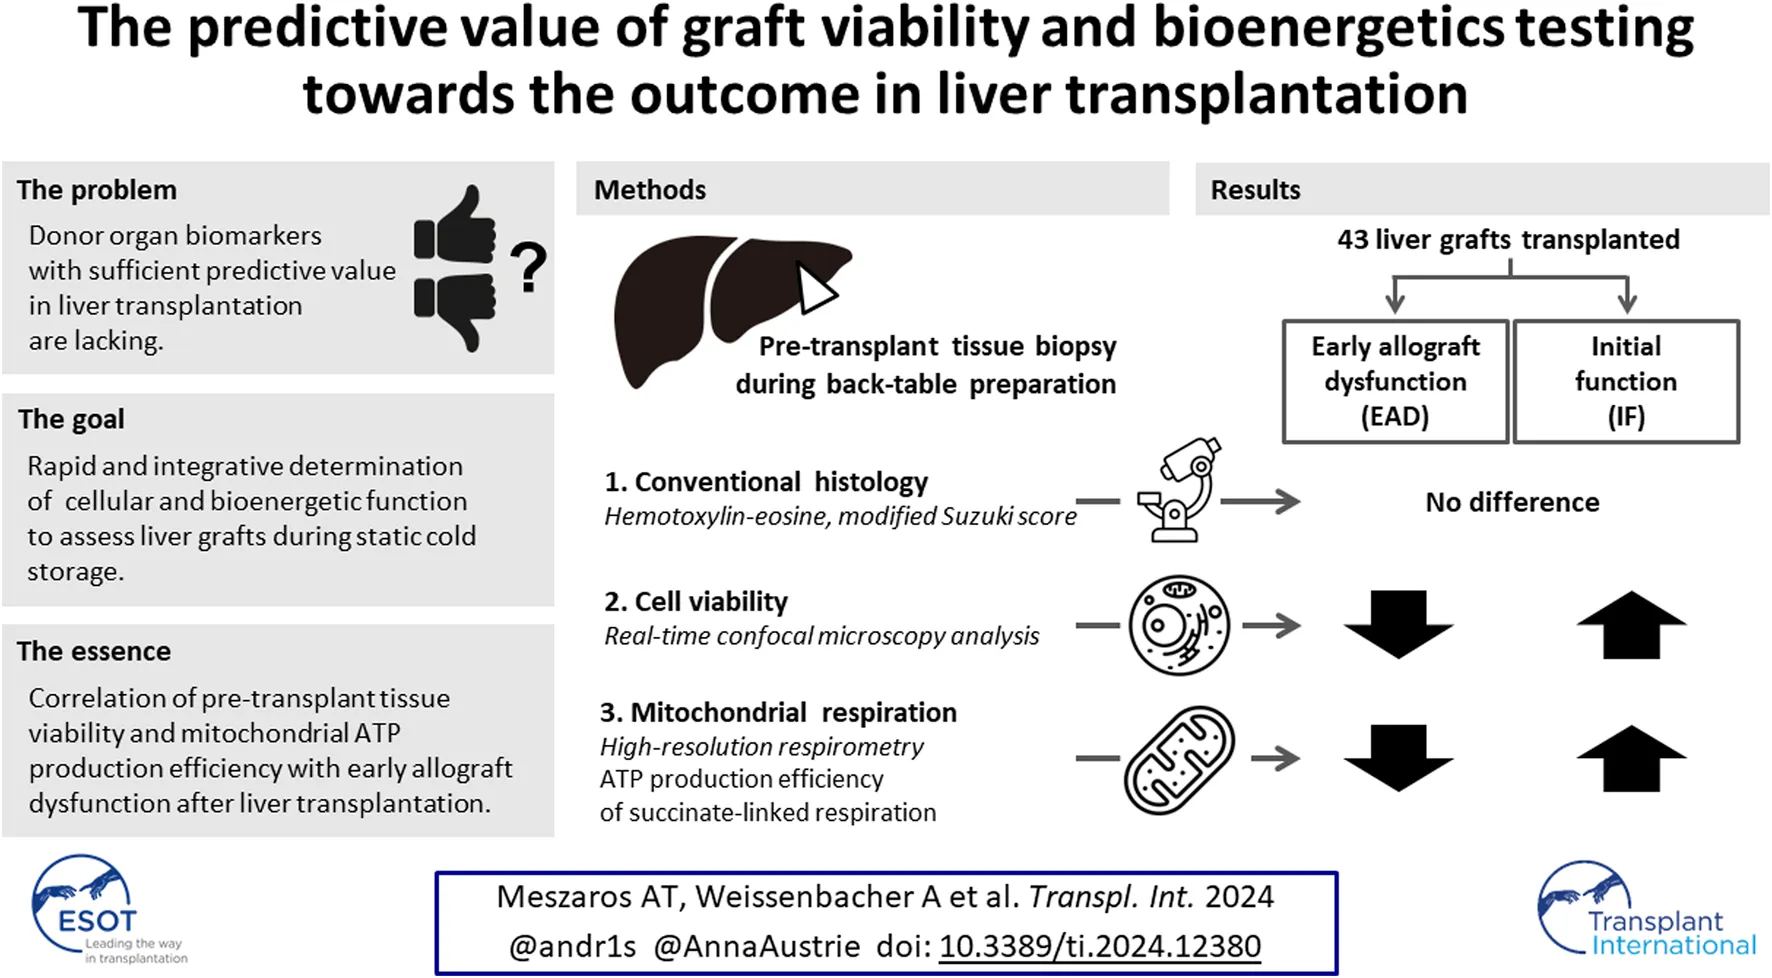
Donor organ biomarkers with sufficient predictive value in liver transplantation (LT) are lacking. We herein evaluate liver viability and mitochondrial bioenergetics for their predictive capacity towards the outcome in LT. We enrolled 43 consecutive patients undergoing LT. Liver biopsy samples taken upon arrival after static cold storage were assessed by histology, real-time confocal imaging analysis (RTCA), and high-resolution respirometry (HRR) for mitochondrial respiration of tissue homogenates. Early allograft dysfunction (EAD) served as primary endpoint. HRR data were analysed with a focus on the efficacy of ATP production or P-L control efficiency, calculated as 1-L/P from the capacity of oxidative phosphorylation P and non-phosphorylating respiration L. Twenty-two recipients experienced EAD. Pre-transplant histology was not predictive of EAD. The mean RTCA score was significantly lower in the EAD cohort (−0.75 ± 2.27) compared to the IF cohort (0.70 ± 2.08; p = 0.01), indicating decreased cell viability. P-L control efficiency was predictive of EAD (0.76 ± 0.06 in IF vs. 0.70 ± 0.08 in EAD-livers; p = 0.02) and correlated with the RTCA score. Both RTCA and P-L control efficiency in biopsy samples taken during cold storage have predictive capacity towards the outcome in LT. Therefore, RTCA and HRR should be considered for risk stratification, viability assessment, and bioenergetic testing in liver transplantation.
Introduction
The limited number of organ donors and the low number of livers of deceased donors with optimal organ quality are key restricting factors in liver transplantation (LT). While the indications for LT are increasing, many technical aspects and tools for the assessment of graft quality have not changed [, ]. The outcomes have been improving steadily with LT survival rates reaching 90% after the first year [], but up to 20% of patients are dying while waiting or being removed from the liver transplant waiting list due to the scarcity of available organs [, –]. Current efforts to enlarge the donor pool and to increase organ utilization is the inclusion of livers from extended criteria donors (ECD), from donors after circulatory death (DCD), steatotic organs, and livers with longer cold and warm ischemia times [, , ]. Accepting such pre-injured organs for LT is afflicted with an increased risk of morbidity and mortality [–]. The above grafts are more susceptible to temperature fluctuations, ischemia and re-oxygenation (ischemia-reperfusion injury, IRI). Furthermore, the activation of damage associated molecular pattern proteins (DAMPs) in the donor (as a response of brain death) during reperfusion results in secretion of proinflammatory cytokines triggering inflammation and consecutive damage of the liver [, ].
In addition to the inflammatory response, the impairment of mitochondrial function during IRI is considerable. Oxygen deprivation, ATP depletion, and the enhanced generation of reactive oxygen species (ROS) during reperfusion can alter the bioenergetic status and mitochondrial integrity [, –]. While many mechanisms contributing to IRI and the subsequent organ dysfunction are known, further details and their immediate clinical implications remain to be elucidated. Both the assessment of cell viability and bioenergetic function have merit in the search for biomarkers with such predictive value.
Previously, Martins et al. described a clear relationship between IRI and impaired mitochondrial respiration in liver transplantation. In a murine model, mild hypothermia was protective against loss of mitochondrial membrane potential []. A correlation was demonstrated in a clinical trial between LT and mitochondrial function, aminotransferase peaks, and arterial lactate levels []. More recently, a correlation between mitochondrial injury and the outcome in LT has been suggested. Hypothermic oxygenated machine perfusion (HOPE) may improve cellular bioenergetics and flavin mononucleotide (FMN) was proposed as a biomarker, a shedding product of the mitochondrial Complex I monitored in the perfusate during machine perfusion [, ]. While the analysis of metabolic products such as FMN may indicate mitochondrial damage, it does not allow for evaluation of the actual bioenergetic capacity.
In addition to the bioenergetic function, the assessment of cell viability and damage during and after LT may help to predict the fate of an organ. Real-time confocal analysis (RTCA) of tissue samples was found to have predictive value toward the occurrence of delayed graft function in kidney biopsies []. This method was validated in a murine liver warm ischemia model [] and its applicability for characterization of cell viability during clinical liver NMP was recently demonstrated [].
We have previously assessed mitochondrial respiration during normothermic machine perfusion (NMP) of the liver and found a predictive capacity towards the outcome after LT []. The aim of the present study was to evaluate the relevance and capacity of RTCA and HRR in clinical LT after static cold storage (SCS). We hypothesized that both cell viability assessment and evaluation of mitochondrial respiratory function provide integrative assessments of subcellular and cellular function and damage to liver grafts. Our goal was to employ methods for rapid assessment without the need for isolation of mitochondria or tissue fixation. Our results confirm a correlation between RTCA and mitochondrial function and the outcome after LT.
Materials and Methods
Clinical Trial Design
Based on a previously established technology with RTCA [, , ], a prospective, single arm, observational clinical trial was conducted at the Medical University of Innsbruck between October 2017 and October 2019. The study was approved by the institutional review board of the Medical University of Innsbruck (vote number 1025/2017). All patients participating in the trial signed the respective informed consent form.
All liver grafts stemmed from donors after brain death and none of the livers underwent machine perfusion.
Forty-three consecutive patients were included in this trial. Recipient, donor, and transplant characteristics were collected and collated. Early allograft dysfunction (EAD) served as primary endpoint, Model for Early Allograft Function (MEAF []) Liver Graft Assessment Following Transplantation (L-GrAFT [, ]), graft and patient survival, length of stay and biliary complications served as secondary endpoints. EAD was defined as the presence of one or more of i) bilirubin ≥10 mg·dL−1 on day seven after transplantation, ii) international normalized ratio (INR) ≥ 1.6 on day seven, and iii) alanine (ALT) or aspartate aminotransferases (AST) > 2000 IU·L−1 within the first 7 days after liver transplantation [].
Sampling and Preparing Liver Biopsies for Real-Time Live Confocal Imaging
Liver wedge biopsies were taken during the back-table preparation. All biopsy samples were placed in HTK solution (Custodiol®, Dr. Franz Köhler Chemie GmbH, Bensheim, Germany) on ice for transportation prior to analysis.
Real-time live confocal microscopy assessment was performed using the following live stains: Wheat germ agglutinin conjugate (WGA; Molecular Probes, Eugene, OR, United States; 10 μg·mL−1 final concentration) visualizes the tissue morphology, SYTO®16 (Molecular Probes; final concentration 5 µM) visualizes all nuclei and propidium iodide (PI) (Molecular Probes; final concentration 500 nM) the nuclei of dead cells []. Incubation time was 15 min at 37°C. Real-time live confocal imaging was performed in eight-well chambered cover glasses (Nalge Nunc International). Images were acquired with a spinning disk confocal system (UltraVIEW VoX; Perkin Elmer, Waltham, MA) connected to a Zeiss Axio Observer Z1 microscope (Zeiss, Oberkochen, Germany) and visualized employing the Volocity software (Perkin Elmer) using a ×10 objective. Time for readout was approximately 5 min per sample.
High-Resolution Respirometry
High-resolution respirometry (HRR, O2k, Oroboros Instruments, Innsbruck, Austria) was applied to assess mitochondrial respiration. All measurements were carried out in O2k-chambers of 2 mL at 37°C under constant stirring at 750 rpm []. Data were acquired at intervals of 2 s and analysed with the DatLab software (Datlab 7.4, Oroboros Instruments, Innsbruck, Austria). Besides monthly instrumental background calibrations, before each experiment, air-calibration was performed with MiR05 mitochondrial respiration medium (MiR05-Kit, Oroboros Instruments, Innsbruck, Austria). The finally prepared medium consists of 0.5 mM EGTA, 3 mM MgCl2 • 6 H2O, 60 mM lactobionic acid, 20 mM taurine, 10 mM KH2PO4, 20 mM HEPES, 110 mM D-sucrose, 1 g·L−1 essentially fatty acid free bovine serum albumin. Twenty mg of liver tissue was dissected on a cooled plate at 4°C, weighted, and subsequently homogenized in 4°C MiR05 using a PBI-Shredder O2k-Set (Oroboros Instruments, Innsbruck, Austria) according to the manufacturer’s instructions. 2-mL tissue homogenate with a final concentration of 1 mg wet mass·mL−1 was immediately added into each of the O2k-chambers. Chemicals for the pre-defined substrate-uncoupler-inhibitor titration (SUIT) protocols were titrated using glass microsyringes (Oroboros Instruments, Innsbruck, Austria). The SUIT protocols (i; corresponding SUIT-0251) and (ii; corresponding SUIT-006 O2 mt D0472) are defined in the Supplementary Tables S1, S2. Each titration step was carried out after respiration reached a steady state. Measurements were performed in technical duplicates.
Respiration rates were expressed as O2 flux per wet mass tissue [pmol O2·s−1·mg−1].
Three substrate pathways delivering convergent electron flow to the electron transport system were investigated. The fatty acid oxidation (FAO)-pathway F was determined in the presence of octanoylcarnitine and a low concentration of malate, the NADH-pathway N with the substrates pyruvate, glutamate, and malate. The succinate-linked pathway S was assessed after inhibiting the mitochondrial Complex I with rotenone and adding succinate. In addition to studying these pathways separately, the combined pathways FNS feeding electrons into the coenzyme Q-junction were investigated to reconstitute the tricarboxylic acid cycle function of the living cell and determine possible additive effects []. For further details, see Supplementary Tables S1, S2.
Respiratory capacities were normalized to an internal reference rate for each measurement to determine flux control ratios (FCR) for evaluation of SUIT protocol (i). For SUIT protocol (ii) the coupling states LEAK (L), OXPHOS (P), and OXPHOS(c) (Pc), were evaluated []. LEAK, a dissipative component of respiration, was measured in the presence of the mitochondrial Complex I inhibitor rotenone and reducing substrate succinate without ADP (rate SL). The respiratory capacity of oxidative phosphorylation (OXPHOS) was assessed in the presence of succinate, 5 mM ADP, and 10 mM inorganic phosphate in MiR05 (SP). Finally, cytochrome c was added to test the integrity of the mitochondrial outer membrane, obtaining the rate SPc. Based on the above, the following control efficiencies were calculated for the succinate pathway: P-L control efficiency (1-L/P), to evaluate the efficiency of ATP production in the succinate pathway, and cytochrome c control efficiency (jc = 1-P/Pc) to evaluate the damage to the mitochondrial outer membrane [].
Real-Time Confocal Analysis
In each liver biopsy, 10 optical sections of 1 µm were analysed. Cell viability and matrix architecture of the liver were quantified by counting events (one event is either a viable or a non-viable cell) and groups which comprise i) total count of cells, irrespective of the localization; ii) cells from the central vein area; iii) cells from the portal triad area.
For each group, the number (total count) of viable cells was divided by the number of non-viable cells (total count) with following possible results: (+1) for highly viable biopsies/areas with more viable than non-viable cells; (0) for biopsies/areas in which the number of viable cells equals the one of non-viable cells; (−1) for those in which the number of non-viable cells outnumbers the one of viable cells. For each biopsy, a score was calculated consisting of two central vein areas and one portal triad area resulting in a maximum of +3 points in the best or −3 in the worst-case scenario.
Histopathological Assessment
After completion of live confocal imaging, the liver biopsy was placed and fixed in Millonig’s solution and processed for paraffin embedding. Four µm thick sections were stained by haematoxylin and eosin as per standard protocols. Light microscopy observations were carried out on a Nikon Eclipse 50i microscope (Nikon Corporation, Japan). Histological assessment was performed according to a modified Suzuki score [] based on necrosis, steatosis, inflammation, fibrosis and vascular changes (Supplementary Table S3). An overall histopathologic score indicated i) normal liver tissue or only mild histopathologic alterations—score 3 (subscores 0 or 1), ii) moderate histopathologic alterations—score 2 (at least one subscore 2), or iii) severe histopathologic alterations—score 1 (at least one subscore 3). Slide scanning was performed on an Olympus VS120 microscope and evaluated using Olympus OlyVIA software.
Statistical Analysis
The statistical testing was done with Graph Pad Prism 9 and IBM® SPSS® Statistics Version 25. A p-value of <0.05 was considered as statistically significant. Biopsy results (RTCA, histology scores and HRR), recipient, donor and transplant factors were analysed using parametric and non-parametric tests (including Spearman rank correlation). The RTCA score and P-L control efficiency were adjusted for clinically relevant parameters and evaluated in uni- and multivariate logistic regression analyses.
Results
Patient Demographics and Early Allograft Dysfunction
Table 2 depicts the demographics and the transplant data of 43 liver transplants stratified for EAD (N = 22, 51.2%) and initial function (IF, N = 21) following liver transplantation. The proportion of ECD was numerically, but not statistically higher in the cohort developing EAD (18/22, 81.1%) compared to patients with IF (13/21, 61.9%), p = 0.27. Recipients with EAD received livers from donors with a significantly higher BMI (28.05 ± 6.29 kg·m−2 in EAD vs. 24.6 ± 4.16 kg·m−2 in IF, mean ± SD; p = 0.031). The Liver and the Eurotransplant donor risk indices (DRI) were comparable between the groups. The anastomosis time was significantly longer in EAD-patients compared to patients with IF livers (47.64 ± 9.86 min in EAD vs. 40.57 ± 5.92 min in IF-patients, p = 0.02). Patients developing EAD had significantly higher mean MEAF-scores (6.68 ± 1.3, compared to liver recipients with IF, 4.77 ± 1.41, p < 0.0001). The mean L-GrAFT score was −0.63 ± 1.13 and corresponded with EAD (−0.26 ± 1.21 in EAD vs. −1.11 ± 0.82 in IF, p = 0.015).
Technical Feasibility
RTCA and scoring in fresh liver wedge biopsy samples collected from donor livers after static cold storage was completed in approximately 30 min. HRR took 90 min including sample preparation. Hence, the two methods which were carried out simultaneously proved to be feasible for immediate assessment albeit requiring availability of staff and respective expertise at the point in time. Both assessments required <40 mg tissue sample (wet mass), and, if the technology is available, have a cost per analysed sample of ca. 200 EUR.
Characterization of Mitochondrial Function in Human Liver Samples
In a first step, we analysed the capacity of mitochondrial oxidative phosphorylation (OXPHOS) in liver crude homogenates for the NADH-linked, fatty acid oxidation (FAO), and succinate pathways (Figure 1A; Table 1). In the biopsies after SCS in the whole cohort (N = 43), respiration was highest for succinate-linked OXPHOS (40.4 ± 12.6 pmol·s−1·mg wet mass−1), with a considerable variation between grafts. In contrast, respiration was markedly lower for the FAO and NADH pathways (10.5 ± 4.3 and 4.3 ± 3.0 pmol·s−1·mg wet mass−1, respectively). No difference was found between the EAD and IF groups.
FIGURE 1
TABLE 1
| EAD (N = 22) | IF (N = 21) | p-value | |
|---|---|---|---|
| Characteristics (mean ± SD) | |||
| Pathway control: OXPHOS capacity per mg wet mass | |||
| FAO pathway FP [pmol·s−1·mg−1] | 10.75 ± 4.37 | 10.26 ± 4.23 | ns |
| NADH pathway NP [pmol·s−1·mg−1] | 4.12 ± 2.88 | 4.43 ± 3.09 | ns |
| Succinate pathway SP [pmol·s−1·mg−1] | 42.94 ± 12.62 | 40.04 ± 13.19 | ns |
| Convergent pathway FNSP [pmol·s−1·mg−1] | 43.50 ± 13.25 | 40.61 ± 14.06 | ns |
| FAO pathway FCR (relative to FNS) | 0.25 ± 0.06 | 0.24 ± 0.06 | ns |
| NADH pathway FCR (relative to FNS) | 0.09 ± 0.06 | 0.11 ± 0.06 | ns |
| Succinate pathway FCR (relative to FNS) | 0.99 ± 0.03 | 0.99 ± 0.03 | ns |
| Coupling control: Succinate pathway characteristics | |||
| LEAK respiration SL [pmol·s−1·mg−1] | 12.07 ± 5.64 | 9.67 ± 3.67 | ns |
| OXPHOS capacity SP [pmol·s−1·mg−1] | 40.76 ± 16.26 | 38.83 ± 11.19 | 0.94 |
| Cytochrome c control efficiency, 1-SP/SPc | 0.17 ± 0.12 | 0.11 ± 0.09 | 0.12 |
| P-L control efficiency, 1-SL/SP | 0.70 ± 0.08 | 0.76 ± 0.06 | 0.02 |
High-resolution respirometry.
Statistically significant differences are bold.
Next, we calculated the flux control ratios (FCR) as the single pathway capacities relative to the maximum OXPHOS respiration reached with the combination of all substrates. As shown in Figure 1B; Table 1, succinate-linked respiration alone was sufficient to saturate OXPHOS capacity. This pattern of pathway control reflects an incomplete additivity []. Thus, our detailed analysis of mitochondrial function and calculation of the coupling control efficiencies focused on the S pathway.
Early Allograft Dysfunction, RTCA, HRR, and Histology
The assessment of RTCA and P-L coupling control efficiency revealed significant differences between EAD and IF livers: The mean RTCA score was significantly lower in the EAD cohort (0.75 ± 2.27 compared to 0.70 ± 2.08 in the IF cohort; p = 0.01), indicating a decreased cell viability. In agreement with the RTCA results, the P-L control efficiency was significantly better and predictive of IF (mean P-L control efficiency of 0.76 ± 0.06 in IF-livers vs. 0.70 ± 0.08 in EAD-livers; p = 0.02; Table 2; Figures 2, 3). The MEAF score correlated negatively with the RTCA score; p = 0.01, Spearman’s rho correlation coefficient −0.407; a lower viability correlated with a higher risk of liver dysfunction. Nonparametric correlation analysis showed that RTCA and P-L control efficiency are closely linked: p = 0.005, Spearman’s rho correlation coefficient was 0.493. When RTCA score and P-L control efficiency were adjusted for recipient and donor age as strongest confounders, the significance of both RTCA and OXPHOS coupling was confirmed (Table 3).
TABLE 2
| EAD (N = 22) | IF (N = 21) | p-value | |
|---|---|---|---|
| Characteristics | |||
| Donor age, [y] (mean ± SD) | 52.45 ± 15.46 | 48.33 ± 15.65 | 0.40 |
| Donor BMI [kg·m−2] (mean ± SD) | 28.05 ± 6.29 | 24.60 ± 4.16 | 0.03 |
| Extended criteria donor (ECD)—(N, %) | 18 (81.8%) | 13 (61.9%) | 0.27 |
| Age >65 years | 5 (27.8%) | 2 (15.4%) | |
| BMI >30 kg·m−2 | 4 (22.2%) | 2 (15.4%) | |
| Macrovesicular steatosis >30% | 5 (27.8%) | 1 (7.7%) | |
| ICU-stay >7 days | 2 (11.1%) | 1 (7.7%) | |
| Infection serology | 2 (11.1%) | 1 (7.7%) | |
| Hypernatremia (Na-peak >165 mEq·L−1) | 1 (5.6%) | 1 (7.7%) | |
| Aspartate aminotransferase >90 U·L−1 | 5 (27.8%) | 5 (38.5%) | |
| Alanine aminotransferase >105 U·L−1 | 3 (16.7%) | 4 (30.8%) | |
| Total bilirubin >3 mg·dL−1 | 3 (16.7%) | 4 (30.8%) | |
| LDRI (mean ± SD) | 1.60 ± 0.34 | 1.51 ± 0.28 | 0.33 |
| ET-DRI (mean ± SD) | 1.75 ± 0.42 | 1.60 ± 0.28 | 0.19 |
| Recipient age [y] (median, min-max) | 60.23 ± 10.39 | 59.24 ± 9.29 | 0.48 |
| Recipient BMI [kg·m-2] (mean, SD) | 26.61 ± 5.10 | 25.72 ± 5.26 | 0.59 |
| Prior transplantation (N, %) | 1 (4.6%) | 2 (9.5%) | |
| MELD score (mean ± SD) | 16.41 ± 7.41 | 18.80 ± 8.00 | 0.38 |
| Cold ischemia time [h] (mean ± SD) | 8.41 ± 1.99 | 7.82 ± 2.26 | 0.5 |
| Anhepatic time [min] (mean ± SD) | 61.05 ± 19.54 | 52.29 ± 16.03 | 0.05 |
| Anastomosis time [min] (mean ± SD) | 47.64 ± 9.86 | 40.57 ± 5.92 | 0.02 |
| Length of hospital stay [days] (median, IQR) | 18.5 (15, 23.5) | 19 (14.5, 28.5) | 0.61 |
| ICU stay after LT [days] (median, IQR) | 4.5 (3, 7) | 4 (2.5, 9.5) | 0.81 |
| RTCA score | −0.75 ± 2.27 | 0.70 ± 2.08 | 0.01 |
| High-resolution respirometry | |||
| OXPHOS capacity SP [pmol·s−1·mg wet mass-1] | 40.76 ± 16.26 | 38.83 ± 11.19 | 0.94 |
| Cytochrome c control efficiency, 1-SP/SPc | 0.17 ± 0.12 | 0.11 ± 0.09 | 0.12 |
| P-L control efficiency, 1-SL/SP | 0.70 ± 0.08 | 0.76 ± 0.06 | 0.02 |
| Histology | 2.52 ± 0.68 | 2.85 ± 0.49 | 0.06 |
| Necrosis | 0.41 ± 0.96 | 0.33 ± 0.73 | 0.87 |
| Steatosis | 0.64 ± 0.85 | 0.43 ± 0.60 | 0.61 |
| Inflammation | 0.65 ± 0.59 | 0.30 ± 0.47 | 0.08 |
| Fibrosis | none | none | n.a |
| Vasculitis | 0.20 ± 0.41 | 0.20 ± 0.41 | 1.000 |
Demographics and transplant factors of liver transplant recipients with analyzed biopsies (RTCA, HRR, histology).
Statistically significant differences are bold.
FIGURE 2
FIGURE 3
TABLE 3
| Model A | Wald | Odds ratio | 95% CI | p-value |
|---|---|---|---|---|
| Recipient age | 0.126 | 0.987 | 0.921–1.059 | 0.723 |
| Donor age | 0.846 | 1.024 | 0.974–1.076 | 0.358 |
| RTCA score | 3.886 | 0.736 | 0.542–0.998 | 0.049 |
| Model B | Wald | Odds Ratio | 95% CI | p-value |
| Recipient age | 0.268 | 0.979 | 0.905–1.060 | 0.610 |
| Donor age | 0.070 | 0.994 | 0.948–1.041 | 0.791 |
| P-L control efficiency 1-SL/SP | 3.918 | 0.000 | 0.000–0.893 | 0.048 |
RTCA score and P-L control efficiency as factors impacting EAD—adjusted for age.
Statistically significant differences are bold.
In contrast, histology did not differ between EAD and IF, although there was a trend towards better overall scores in the IF group (Table 2; Figure 4). Accordingly, none of the individual histopathological features such as necrosis, steatosis, inflammation, and vasculitis correlated with the outcome.
FIGURE 4
Graft and Patient Survival
The 90-day mortality was 7.0% (3/43; 2 after EAD); 90-day graft loss was 4.7% (2/43; 1 after EAD). Eight patients (8/43, 18.6%, 6 after EAD) died during the follow up; three patients (3/43, 7.0%, 2 after EAD) had to undergo a re-transplant within the first year after transplant. The succinate-linked OXPHOS capacity was predictive for patient survival in the univariate Cox regression analysis.
Overall graft loss and patient death were numerically higher in the EAD group, but not significantly different in comparison to IF livers; graft loss after EAD 4/22 (18.2%) vs. IF 1/21 (4.8%), p = 0.18; death after EAD 6/22 (27.3%) vs. 3/21 (14.3%), p = 0.31. Re-transplantation was the only risk factor independently predictive for graft survival in the univariate Cox regression analysis; p = 0.04, HR 19.3, Wald 4.4. Univariate and multivariate analyses for patient survival are displayed in Tables 4, 5. The most important and independent factor for patient survival was also re-transplantation; p = 0.001, HR 105.2, Wald 10.279.
TABLE 4
| Characteristic | Wald | HR | 95% CI | p-value |
|---|---|---|---|---|
| Recipient age [y] | 4.43 | 0.943 | 0.892–0.996 | 0.035 |
| Recipient BMI [kg·m−2] | 0.139 | 1.026 | 0.896–1.176 | 0.71 |
| Recipient sex | 0.547 | 0.553 | 0.115–2.662 | 0.46 |
| BAR score | 0.086 | 1.018 | 0.905–1.144 | 0.8 |
| Prior Tx | 12.776 | 66.01 | 6.635–656.759 | < 0.001 |
| Donor age in [y] | 0.005 | 1.001 | 0.960–1.044 | 0.945 |
| Donor BMI [kg·m−2] | 0.02 | 0.991 | 0.882–1.115 | 0.887 |
| Donor sex | 0.114 | 0.797 | 0.214–2.973 | 0.736 |
| Extended criteria donor (ECD) | 1.282 | 3.326 | 0.415–26.637 | 0.258 |
| ET-DRI | 3.269 | 3.56 | 0.899–14.100 | 0.071 |
| LDRI | 2.347 | 5.469 | 0.622–48.090 | 0.126 |
| Cold ischemia time [h] | 1.734 | 1.004 | 0.998–1.009 | 0.19 |
| Anastomosis time [min] | 0.451 | 1.023 | 0.958–1.093 | 0.5 |
| RTCA score | 1.236 | 1.196 | 0.872–1.641 | 0.266 |
| Succinate-linked OXPHOS capacity SP[pmol·s−1·mg wet mass−1] | 4.955 | 1.054 | 1.006–1.104 | 0.03 |
| P-L control efficiency 1-SL/SP | 1.344 | 0.003 | 0.000–56.131 | 0.25 |
| Steatosis in zero biopsy | 0.268 | 1.237 | 0.554–2.764 | 0.6 |
| Necrosis in zero biopsy | 0.332 | 0.742 | 0.267–2.054 | 0.6 |
| EAD | 0.768 | 1.859 | 0.464–7.440 | 0.381 |
| Graft loss | 8.995 | 7.657 | 2.025–28.958 | 0.003 |
Univariate Cox regression analysis—patient survival.
Statistically significant differences are bold.
TABLE 5
| Characteristic | Wald | HR | 95% CI | p-value |
|---|---|---|---|---|
| Recipient age [y] | 0.624 | 0.965 | 0.884–1.054 | 0.429 |
| Prior transplantation | 10.279 | 105.188 | 6.108–1811.585 | 0.001 |
| Succinate–linked OXPHOS capacity SP [pmol·s−1·mg wet mass-1] | 0.209 | 1.018 | 0.944–1.097 | 0.65 |
| Graft loss | 2.724 | 6.494 | 0.704–59.878 | 0.099 |
Multivariate Cox regression analysis—patient survival.
Statistically significant differences are bold.
Discussion
In this prospective clinical pilot trial, we assessed liver biopsies using HRR and RTCA during SCS. We found both methods applicable, clinically feasible and more meaningful for the short-term outcome after LT when compared to standard haematoxylin and eosin histology of pre-implantation biopsies. Our approach with analysis during SCS was designed to mimic a pre-transplant decision-making process, similar as aided by routine frozen section histology.
Martins and co-workers previously evaluated mitochondrial function as a possible tool to determine graft quality before LT []. Their comprehensive study design included measurement of mitochondrial respiration, mitochondrial membrane potential, and intracellular ATP content. In the present clinical trial, we aimed at validating HRR as a rapid assay requiring only a small tissue sample mass. We found that P-L control efficiency of the succinate pathway measured before transplantation correlates with EAD. The results of our study are based on a limited number of liver transplants which calls for caution in the interpretation of statistical tests. However, mitochondrial function was aligned with the RTCA score and correlated with the clinical endpoints, indicating that we are measuring a true and relevant phenomenon.
Recently, Weissenbacher et al. [] published the predictive value of the RTCA score for delayed graft function (DGF) in kidney pre-implantation biopsies. The added value and information of the RTCA in this study is the quantification of the acute and ischemia-related cellular damage in addition to pre-existing injury as characterized by histology. Similar to kidney transplantation, standard histology failed to predict the initial function in LT. The degree of steatosis and necrosis in the pre-implantation biopsy did not correlate with early allograft function. While this might be attributable to the limited sample size, it also relates to the fact that microscopic structural damage is a parameter with limited value towards the decision to transplant or discard an individual organ. The added value of RTCA together with mitochondrial assessment is due to the fact, that these techniques measure, display and quantify the additional acute injury at cellular and subcellular levels.
For HRR, only 2 mg of sample (wet mass) per measurement were required. This is an order of magnitude less when compared to a recent study employing other methods for functional assessment of mitochondrial respiration [] and speaks towards the feasibility of this approach in clinical settings. Instead of time-consuming isolation of mitochondria for HRR, a liver homogenate was prepared using a tissue shredder. This preparation method takes less than 5 min, requires a small sample size, and contains all mitochondrial subpopulations []. Mitochondrial respiration was assessed at 37°C, ruling out temperature-dependent deviations for the extent and mechanism of mitochondrial coupling.
The P-L control efficiency (ratio of net to total OXPHOS capacity) for the succinate pathway was calculated and used as a statistically more robust parameter compared to the classical respiratory acceptor control ratio (RCR), the State 3/State 4 flux ratio []. Importantly, the OXPHOS state is defined by saturating ADP and inorganic phosphate concentrations while State 3 only indicates high ADP and inorganic phosphate concentrations, which are not necessarily saturating.
While RTCA and mitochondrial function were predictive of postoperative organ function, they were not predictive for graft or patient survival. In contrast, the OXPHOS capacity of the mitochondrial succinate pathway was found predictive of patient survival in the univariate analysis. This parameter is closely related to the tissue viability and mitochondrial mass concentration. Recently, our group demonstrated the predictive value of mitochondrial respiratory capacity in a setting of clinical NMP and LT []. In agreement with the published trial, we herein establish the feasibility and value of a functional mitochondrial measurement in standard cold storage and LT.
Whereas the assessment requires fresh tissue, the considerable advantage of HRR and RTCA is the rapid process. For HRR, the tiny tissue sample is rewarmed to 37°C and resupplied with oxygen, mimicking physiological temperatures, thus enabling mitochondrial performance testing despite sampling during SCS.
The high percentage of EAD in the cohort is primarily not a result of a bias due to the relatively low number of transplanted livers. As demonstrated by Fodor et al. [], the rate of EAD in our center raised over the last years, mainly because of increasing acceptance of ECD grafts. Indeed, in the present study cohort, 72% of the liver grafts stemmed from ECD donors. Recent developments with pre-transplant machine perfusion are promising ways to reduce EAD.
In summary, tissue analysis by RTCA and HRR shed light into viability and bioenergetic performance of SCS liver allografts and can be applied to anticipate EAD. Our results further enhance the understanding and relevance of bioenergetic function in liver ischemia and transplantation and provide the basis for further consideration of these parameters as biomarkers in LT. These observations confirm previous studies and serve to underline the feasibility of RTCA and mitochondrial functional tests as tools for liver quality assessment prior to transplantation [].
Statements
Data availability statement
The original contributions presented in the study are included in the article/Supplementary Material, further inquiries can be directed to the corresponding authors.
Ethics statement
The studies involving humans were approved by the Institutional Review Board of the Medical University of Innsbruck. The studies were conducted in accordance with the local legislation and institutional requirements. The participants provided their written informed consent to participate in this study.
Author contributions
RO, AW, SS, and EG established the LBC study setup and design and coordinated the team. MS coordinated the HRR measurements. AM, AW, and MS analysed the data and wrote the manuscript together with SS. RO, AM, MS, TE-B, MH, JU, CM, BR, JH, BZ, TH, TR, CM, MM, TK, BC, and EG participated in data collection, data analysis and critical revision of the manuscript. TK and EG contributed reagents, analytic tools and participated in data analysis. HU participated in data analysis and statistical support. DÖ, JT, and SS supported the study, contributed research advice, and revised the manuscript critically. All authors contributed to the article and approved the submitted version.
Funding
ÖNB Grant awarded to RO (Jubiläumsfondsprojekt, Nr. 17287).
Acknowledgments
We thank Oroboros Instruments for providing instruments and technical support for high-resolution respirometry.
Conflict of interest
EG is founder and CEO of Oroboros Instruments.
The remaining authors declare that the research was conducted in the absence of any commercial or financial relationships that could be construed as a potential conflict of interest.
Supplementary material
The Supplementary Material for this article can be found online at: https://www.frontierspartnerships.org/articles/10.3389/ti.2024.12380/full#supplementary-material
Glossary
- ALT
alanine aminotransferase
- AST
aspartate aminotransferase
- ATP
adenosine triphosphate
- BAR
balance of risk
- BMI
body mass index
- DAMP
damage associated molecular pattern
- DCD
donation after circulatory death
- EAD
early allograft dysfunction
- ECD
extended criteria donors
- ET-DRI
Eurotransplant donor risk index
- F
FAO pathway
- FAO
fatty acid oxidation
- FCR
flux control ratio
- FMN
flavin mononucleotide
- HOPE
hypothermic oxygenated machine perfusion
- HR
hazard ratio
- HRR
high-resolution respirometry
- IF
initial function
- IRI
ischemia-reperfusion injury
- L
LEAK respiration
- LDRI
Liver donor risk index
- LEAK
the state of non-phosphorylating resting respiration in the absence of ADP
- L-GrAFT
Liver Graft Assessment Following Transplantation
- LT
liver transplantation
- MEAF
Model for Early Allograft Function
- N
NADH-linked pathway
- OXPHOS
oxidative phosphorylation
- P
respiratory OXPHOS rate in the presence of kinetically saturating ADP
- PI
propidium iodide
- ROS
reactive oxygen species
- RTCA
real-time confocal imaging analysis
- S
succinate-linked pathway
- SCS
static cold storage
- SUIT
Substrate-Uncoupler-Inhibitor Titration
- WGA
wheat germ agglutinin
Footnotes
References
1.
HughesCBHumarA. Liver Transplantation: Current and Future. Abdom Radiol (NY) (2021) 46(1):2–8. 10.1007/s00261-019-02357-w
2.
NeubergerJ. Liver Transplantation in the United Kingdom. Liver Transpl (2016) 22(8):1129–35. 10.1002/lt.24462
3.
OPTN. Data (2024). Available from: https://optn.transplant.hrsa.gov/data/ (Accessed January 31, 2024).
4.
WingfieldLRCeresaCThorogoodSFleuriotJKnightS. Using Artificial Intelligence for Predicting Survival of Individual Grafts in Liver Transplantation: A Systematic Review. Liver Transpl (2020) 26(7):922–34. 10.1002/lt.25772
5.
KwongAKimWRLakeJRSmithJMSchladtDPSkeansMAet alOPTN/SRTR 2018 Annual Data Report: Liver. Am J Transpl (2020) 20(s1):193–299. 10.1111/ajt.15674
6.
NeubergerJTrotterPStrattonR. Organ Transplantation Rates in the UK. Bmj (2017) 359:j5218. 10.1136/bmj.j5218
7.
KubalCRollGREkserBMuiesanP. Donation After Circulatory Death Liver Transplantation: What Are the Limits for an Acceptable DCD Graft?Int J Surg (2020) 82s:36–43. 10.1016/j.ijsu.2020.04.064
8.
FloresAAsraniSK. The Donor Risk index: A Decade of Experience. Liver Transpl (2017) 23(9):1216–25. 10.1002/lt.24799
9.
RobertsonFPFullerBJDavidsonBR. An Evaluation of Ischaemic Preconditioning as a Method of Reducing Ischaemia Reperfusion Injury in Liver Surgery and Transplantation. J Clin Med (2017) 6(7):69. 10.3390/jcm6070069
10.
SelznerMClavienPA. Fatty Liver in Liver Transplantation and Surgery. Semin Liver Dis (2001) 21(1):105–13. 10.1055/s-2001-12933
11.
CallaghanCJCharmanSCMuiesanPPowellJJGimsonAEvan der MeulenJHet alOutcomes of Transplantation of Livers From Donation After Circulatory Death Donors in the UK: A Cohort Study. BMJ Open (2013) 3(9):e003287. 10.1136/bmjopen-2013-003287
12.
VeteläinenRvan VlietAGoumaDJvan GulikTM. Steatosis as a Risk Factor in Liver Surgery. Ann Surg (2007) 245(1):20–30. 10.1097/01.sla.0000225113.88433.cf
13.
HanHDesertRDasSSongZAthavaleDGeXet alDanger Signals in Liver Injury and Restoration of Homeostasis. J Hepatol (2020) 73(4):933–51. 10.1016/j.jhep.2020.04.033
14.
MartinsRMTeodoroJSFurtadoEOliveiraRCTralhãoJGRoloAPet alMild Hypothermia During the Reperfusion Phase Protects Mitochondrial Bioenergetics Against Ischemia-Reperfusion Injury in an Animal Model of Ex-Vivo Liver Transplantation-An Experimental Study. Int J Med Sci (2019) 16(9):1304–12. 10.7150/ijms.34617
15.
MartinsRMTeodoroJSFurtadoERoloAPPalmeiraCMTralhãoJG. Evaluation of Bioenergetic and Mitochondrial Function in Liver Transplantation. Clin Mol Hepatol (2019) 25(2):190–8. 10.3350/cmh.2018.0087
16.
SchlegelAMullerXMuellerMStepanovaAKronPde RougemontOet alHypothermic Oxygenated Perfusion Protects From Mitochondrial Injury Before Liver Transplantation. EBioMedicine (2020) 60:103014. 10.1016/j.ebiom.2020.103014
17.
MullerXSchlegelAKronPEshmuminovDWürdingerMMeierhoferDet alNovel Real-Time Prediction of Liver Graft Function During Hypothermic Oxygenated Machine Perfusion Before Liver Transplantation. Ann Surg (2019) 270(5):783–90. 10.1097/sla.0000000000003513
18.
WeissenbacherAOberhuberRHermannMSoleimanAUlmerHMayerGet alLive Confocal Tissue Assessment With SYTO16/PI and WGA Staining Visualizes Acute Organ Damage and Predicts Delayed Graft Function in Kidney Transplantation. Ann Surg (2019) 270(5):915–22. 10.1097/sla.0000000000003511
19.
CardiniBFodorMHermannMWieserVHautzTMellitzerVet alLive Confocal Imaging as a Novel Tool to Assess Liver Quality: Insights From a Murine Model. Transplantation (2020) 104(12):2528–37. 10.1097/tp.0000000000003405
20.
MeszarosATHofmannJBuchMLCardiniBDunzendorfer-MattTNardinFet alMitochondrial Respiration During Normothermic Liver Machine Perfusion Predicts Clinical Outcome. EBioMedicine (2022) 85:104311. 10.1016/j.ebiom.2022.104311
21.
AshrafMIFriesDStreifWAignerFHengsterPTroppmairJet alBiopsychronology: Live Confocal Imaging of Biopsies to Assess Organ Function. Transpl Int (2014) 27(8):868–76. 10.1111/tri.12338
22.
AshrafMIFriesDStreifWAignerFHengsterPTroppmairJet alBiopsychronology: A Method Using Live Tissue Staining to Image Cell Function in the Kidney. Methods Mol Biol (2016) 1397:81–90. 10.1007/978-1-4939-3353-2_8
23.
ParejaECortesMHervásDMirJValdiviesoACastellJVet alA Score Model for the Continuous Grading of Early Allograft Dysfunction Severity. Liver Transpl (2015) 21(1):38–46. 10.1002/lt.23990
24.
AgopianVGHarlander-LockeMPMarkovicDDumronggittiguleWXiaVKaldasFMet alEvaluation of Early Allograft Function Using the Liver Graft Assessment Following Transplantation Risk Score Model. JAMA Surg (2018) 153(5):436–44. 10.1001/jamasurg.2017.5040
25.
AvolioAWFrancoASchlegelALaiQMeliSBurraPet alDevelopment and Validation of a Comprehensive Model to Estimate Early Allograft Failure Among Patients Requiring Early Liver Retransplant. JAMA Surg (2020) 155(12):e204095. 10.1001/jamasurg.2020.4095
26.
OlthoffKMKulikLSamsteinBKaminskiMAbecassisMEmondJet alValidation of a Current Definition of Early Allograft Dysfunction in Liver Transplant Recipients and Analysis of Risk Factors. Liver Transpl (2010) 16(8):943–9. 10.1002/lt.22091
27.
DoerrierCGarcia-SouzaLFKrumschnabelGWohlfarterYMészárosATGnaigerE. High-Resolution FluoRespirometry and OXPHOS Protocols for Human Cells, Permeabilized Fibers From Small Biopsies of Muscle, and Isolated Mitochondria. Methods Mol Biol (2018) 1782:31–70. 10.1007/978-1-4939-7831-1_3
28.
GnaigerE. Mitochondrial Pathways and Respiratory Control. An Introduction to OXPHOS Analysis. 5th Ed. Bioenerg Commun (2020) 2020:2. 10.26124/bec:2020-0002
29.
SuzukiSToledo-PereyraLHRodriguezFJCejalvoD. Neutrophil Infiltration as an Important Factor in Liver Ischemia and Reperfusion Injury. Modulating Effects of FK506 and Cyclosporine. Transplantation (1993) 55(6):1265–72. 10.1097/00007890-199306000-00011
30.
LaiNKummitha CMRoscaMGFujiokaHTandlerBHoppelCL. Isolation of Mitochondrial Subpopulations From Skeletal Muscle: Optimizing Recovery and Preserving Integrity. Acta Physiol (Oxf) (2019) 225(2):e13182. 10.1111/apha.13182
31.
FodorMWoerdehoffAPeterWEsserHOberhuberRMargreiterCet alReassessment of Relevance and Predictive Value of Parameters Indicating Early Graft Dysfunction in Liver Transplantation: AST Is a Weak, But Bilirubin and INR Strong Predictors of Mortality. Front Surg (2021) 8:693288. 10.3389/fsurg.2021.693288
Summary
Keywords
liver, transplantation, static cold storage, mitochondria, high-resolution respirometry, real-time confocal imaging
Citation
Meszaros AT, Weissenbacher A, Schartner M, Egelseer-Bruendl T, Hermann M, Unterweger J, Mittelberger C, Reyer BA, Hofmann J, Zelger BG, Hautz T, Resch T, Margreiter C, Maglione M, Komlódi T, Ulmer H, Cardini B, Troppmair J, Öfner D, Gnaiger E, Schneeberger S and Oberhuber R (2024) The Predictive Value of Graft Viability and Bioenergetics Testing Towards the Outcome in Liver Transplantation. Transpl Int 37:12380. doi: 10.3389/ti.2024.12380
Received
05 November 2023
Accepted
12 February 2024
Published
23 February 2024
Volume
37 - 2024
Updates
Copyright
© 2024 Meszaros, Weissenbacher, Schartner, Egelseer-Bruendl, Hermann, Unterweger, Mittelberger, Reyer, Hofmann, Zelger, Hautz, Resch, Margreiter, Maglione, Komlódi, Ulmer, Cardini, Troppmair, Öfner, Gnaiger, Schneeberger and Oberhuber.
This is an open-access article distributed under the terms of the Creative Commons Attribution License (CC BY). The use, distribution or reproduction in other forums is permitted, provided the original author(s) and the copyright owner(s) are credited and that the original publication in this journal is cited, in accordance with accepted academic practice. No use, distribution or reproduction is permitted which does not comply with these terms.
*Correspondence: Stefan Schneeberger, stefan.schneeberger@i-med.ac.at ; Rupert Oberhuber, rupert.oberhuber@i-med.ac.at
‡ These authors share first authorship
§ These authors share senior authorship
† Present address: Timea Komlódi, Department of Biochemistry, Semmelweis University, Budapest, Hungary
Disclaimer
All claims expressed in this article are solely those of the authors and do not necessarily represent those of their affiliated organizations, or those of the publisher, the editors and the reviewers. Any product that may be evaluated in this article or claim that may be made by its manufacturer is not guaranteed or endorsed by the publisher.