Abstract
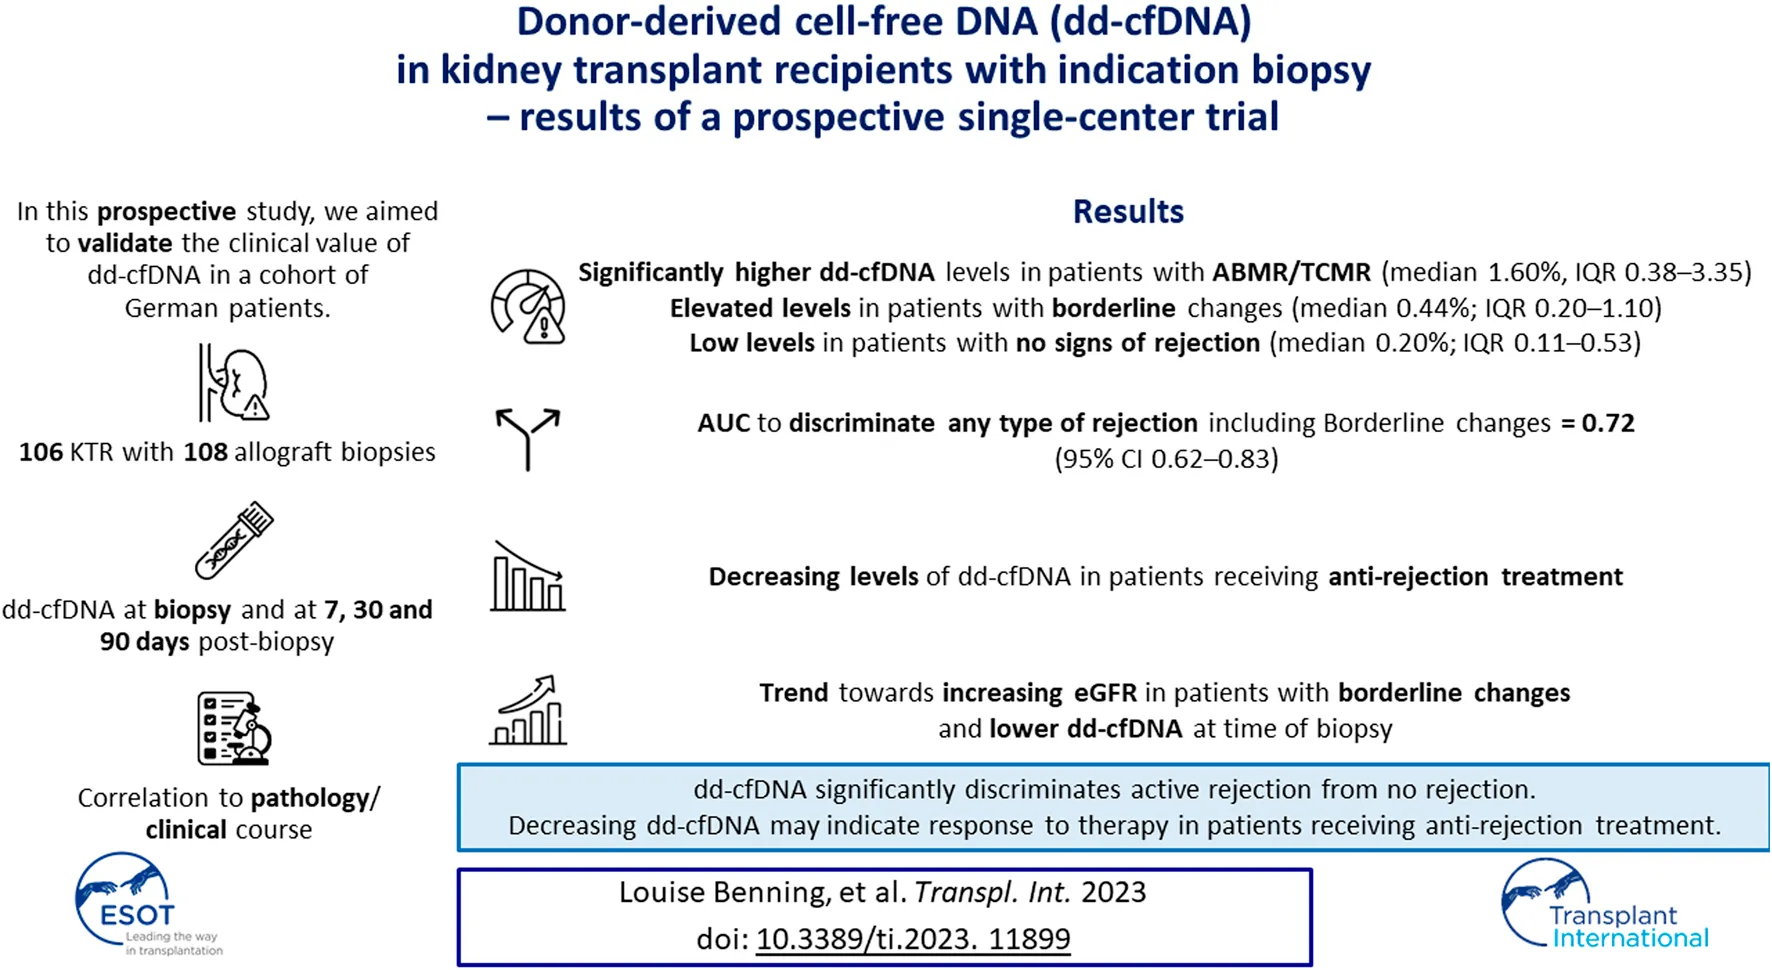
Donor-derived cell-free DNA (dd-cfDNA) identifies allograft injury and discriminates active rejection from no rejection. In this prospective study, 106 kidney transplant recipients with 108 clinically indicated biopsies were enrolled at Heidelberg University Hospital between November 2020 and December 2022 to validate the clinical value of dd-cfDNA in a cohort of German patients. dd-cfDNA was quantified at biopsy and correlated to histopathology. Additionally, dd-cfDNA was determined on days 7, 30, and 90 post-biopsy and analyzed for potential use to monitor response to anti-rejection treatment. dd-cfDNA levels were with a median (IQR) % of 2.00 (0.48–3.20) highest in patients with ABMR, followed by 0.92 (0.19–11.25) in patients with TCMR, 0.44 (0.20–1.10) in patients with borderline changes and 0.20 (0.11–0.53) in patients with no signs of rejection. The AUC for dd-cfDNA to discriminate any type of rejection including borderline changes from no rejection was at 0.72 (95% CI 0.62–0.83). In patients receiving anti-rejection treatment, dd-cfDNA levels significantly decreased during the 7, 30, and 90 days follow-up compared to levels at the time of biopsy (p = 0.006, p = 0.002, and p < 0.001, respectively). In conclusion, dd-cfDNA significantly discriminates active rejection from no rejection. Decreasing dd-cfDNA following anti-rejection treatment may indicate response to therapy.
Clinical Trial Registration: https://drks.de/search/de/trial/DRKS00023604, identifier DRKS00023604.
Introduction
Despite improvements in short-term outcomes after kidney transplantation, mainly driven by improvements in 1 year allograft survival, late allograft failure remains an issue [, ]. In a study of 252,910 patients who received kidney transplants in the United States between 1989 and 2009, Lamb et al found that the zero to 1 year rate for graft loss dropped dramatically from 19.8 to 6.7 during this period while rates beyond the first year only showed marginal improvements []. Analyzing 108,787 patients from the Collaborative Transplant Study transplanted between 1986 and 2015 and accounting for the evolution of donor and recipient characteristics, Coemans et al found that short-term improvement in more recent years since 2000 was less pronounced, while long-term improvement remained largely unchanged in Europe []. Both studies emphasize the pressing need for innovation aimed at improving long-term graft survival.
Meier-Kriesche et al. noted that the limited improvements in long-term allograft survival, despite reduced rejection rates, could be due to acute rejection episodes without complete functional recovery [], which was supported by results from other clinical trials []. Currently, biopsy remains the gold standard for the diagnosis of kidney graft rejection and for the differential diagnosis of kidney graft damage. However, its accessibility is sometimes limited, the right time for biopsy is difficult to determine, and the procedure itself may pose risks, e.g., in obese patients or those requiring anticoagulation. Therefore, there is a need for minimally invasive biomarkers capable of identifying high-risk patients requiring biopsy in the outpatient setting.
In recent years, several advances have been made in follow-up after kidney transplantation, including big data-driven models such as the iBOX to predict allograft survival or new biomarkers such as donor-derived cell-free DNA (dd-cfDNA) to detect early graft damage [, ]. Elevated dd-cfDNA levels reflect allograft damage, and studies have shown that dd-cfDNA can effectively distinguish active rejection from no rejection [–]. The biomarker was validated in a large US multicenter study of 1,092 kidney transplant recipients over a 3 years period, with an increase in dd-cfDNA to 0.5% or more indicating clinically apparent and subclinical rejection []. However, European data on the use of dd-cfDNA is still scarce. In this prospective study, our objective was to analyze dd-cfDNA within a group of German kidney transplant recipients who underwent clinically indicated biopsies, presenting diverse histopathological findings. Our primary aim was to evaluate the sensitivity and specificity of dd-cfDNA in detecting rejection among these patients, and the secondary aim was to explore whether dd-cfDNA levels exhibited changes following anti-rejection therapy, potentially serving as an indicator of treatment response.
Materials and Methods
Study Design
From November 2020 to December 2022, we enrolled 106 kidney transplant recipients from the Department of Nephrology at Heidelberg University Hospital with 108 clinically indicated biopsies into this prospective single-center study. The study was approved by the ethics committee of the University of Heidelberg and conducted in accordance with the Declaration of Helsinki. Written informed consent was obtained from all study participants. The study is registered in the German Clinical Trials Register (DRKS00023604).
Serum creatinine and the estimated glomerular filtration rate (eGFR), proteinuria, donor-specific HLA antibodies (DSA) and non-HLA antibodies, as well as dd-cfDNA were measured the day of biopsy (before biopsy, T0), as well as 7 (T1), 30 (T2), and 90 (T3) days post-biopsy. Clinical follow-up was until day 180 post-biopsy (T4, Figure 1A).
FIGURE 1
Indication Biopsy and Clinical Management According to Histopathological Reporting
Indications for biopsy included acute graft dysfunction (N = 12), creeping creatinine (N = 64) development or worsening of proteinuria (N = 16), detection of donor-specific HLA-antibodies (DSA) with concomitant proteinuria or graft dysfunction (N = 4), or detection of BK viremia with worsening kidney function (N = 12). The biopsy was examined by two board-examined pathologists and reported using the BANFF 2018 reference guide []. Following histopathological reporting, clinical management involved corticosteroid pulse therapy in 27/36 (75%) patients with signs of active rejection, including 19/23 (83%) patients with borderline changes and excluding patients with concomitant infection (N = 4). In addition, 4/6 (67%) patients with T cell-mediated rejection (TCMR) received anti-thymocyte globulin (ATG) and 3/7 (43%) patients with antibody-mediated rejection (ABMR) immunoadsorption. In all 13 patients with BK virus-associated nephropathy (BKVAN, SV40+), immunosuppression was altered from a calcineurin-inhibitor (CNI)-mycophenolic acid (MPA) to a CNI-mTOR regimen. In 12 patients with suspected CNI-toxicity (ah ≥ 1), CNI medication was adapted to lower trough levels (N = 6) or changed to Belatacept (N = 6).
Quantification of Donor-Derived Cell-Free DNA
Venous blood samples were collected into 10 mL Streck cell-free DNA BCT tubes (Streck, Omaha, NE) and examined within 7 days. Plasma was separated by centrifugation at 1,600 × g for 20 min, followed by a second centrifugation at 16,000 × g for 10 min, and either plasma was stored at −80°C or cfDNA was extracted immediately using the Circulating Nucleic Acid kit (Qiagen, Redwood City, CA). cfDNA was then amplified using the AlloSeq cfDNA assay (CareDX, Brisbane, CA), a multiplex PCR including PCR primers for 202 single nucleotide polymorphisms (SNPs). Variations in the SNPs loci are used to determine the proportion of donor-derived (dd)-cfDNA in relation to the total cfDNA present in the plasma sample. The PCR products were subsequently sequenced on a MiniSeq (Illumina, Inc.). Sequence data was analyzed using the CareDx AlloSeq cfDNA software. All steps were performed according to the manufacturers’ instructions and as described previously [, ].
Determination of Donor-Specific HLA Antibodies (DSA) and Non-HLA Antibodies
All patients were screened for DSA and non-HLA antibodies at time of biopsy, as well as 7, 30, and 90 days post-biopsy if serum was available for analysis. Luminex technology was employed to determine HLA antibodies using the LABScreen Single Antigen kit of One Lambda/Thermo Fisher Scientific (West Hills, CA). MFI cutoff of >500 or >1,000 was used to identify DSA against mismatched donor HLA. Testing for non-HLA antibodies included antibodies targeting the major histocompatibility complex class I-related chain A (MICA), angiotensin II type 1 receptor (AT1R) and endothelin receptor subtype A (ETA). MICA antibodies were detected with the LABScreen Mixed kit of One Lambda/Thermo Fisher Scientific (West Hills, CA), whereas AT1R and ETA antibodies were determined with AT1R-IgG-Antibody-ELISA and ETAR-IgG-Antibody-ELISA, respectively (both kits were obtained from CellTrend, Luckenwalde, Germany). Anti-MICA antibodies were found to be associated with ABMR and de-novo anti-MICA development was linked to reduced graft survival []. AT1R and ETA antibodies were also reported to correlate with a higher prevalence of ABMR and a decline in graft function [, ]. Soluble CD30 (sCD30) was assessed using the Human sCD30 Instant ELISA kit of Invitrogen eBioScience/Thermo Fischer Scientific (Bender MedSystems GmbH, Vienna, Austria). Early posttransplant measurements of sCD30 were shown to be predictive of subsequent graft loss, however, the evidence regarding the use of sCD30 as a biomarker in late posttransplant period is limited and its clinical utility remains uncertain [–].
Statistics
Data are presented as number (N) and percent (%), median and interquartile range (IQR) or mean and Standard Deviation (SD). Categorical data were compared using the Fisher’s exact test. To compare non-parametric continuous variables between two independent groups, the Mann-Whitney U test was used. When dealing with more than two independent groups, the Kruskal-Wallis test was employed, followed by Dunn’s post-test for multiple comparisons. Wilcoxon matched-pairs signed rank test was used when comparing non-parametric paired variables. A multiple linear regression analysis was performed to differentiate possible confounders of elevated dd-cfDNA levels. The area under the ROC curves (AUC) was used to evaluate the performance of dd-cfDNA and eGFR in discriminating acute rejection from no rejection. Rejection status was based on histopathological diagnosis of rejection using the BANFF 2018 reference guide []. The Youden index was calculated to give the optimal cut point for dd-cfDNA to discriminate active rejection. In addition, specificity, sensitivity, positive predictive value (PPV) and negative predictive value (NPV) for different dd-cfDNA cutoffs to discriminate acute rejection were calculated using a contingency table. Thresholds of dd-cfDNA levels ≥1%, ≥0.74% and ≥0.5% were applied according to results of the Circulating Donor-Derived Cell-Free DNA in Blood for Diagnosing Active Rejection in Kidney Transplant Recipients (DART) trial [], early experiences using dd-cfDNA to detect rejection in US American kidney transplant recipients [], and a recent trial by Stites et al. to identify TCMR1A and borderline patients with elevated risk of graft injury [], respectively. Spearman’s rho was calculated to assess the correlation between dd-cfDNA levels and histopathological lesion scores or the presence of DSA/non-HLA antibodies. Statistical significance was assumed at a p-value < 0.05. The statistical analysis was performed using GraphPad Prism version 9.5.1 (GraphPad Software, San Diego CA, United States). For analysis purposes, serum creatinine and estimated glomerular filtration rate (eGFR) for patients returning to dialysis were arbitrarily set at 10 mg/dL and 5 mL/min, respectively.
Results
Baseline Characteristics
From November 2020 to December 2022, 106 kidney transplant recipients with a total of 108 graft biopsies were enrolled. dd-cfDNA was quantified at day of indication biopsy (T0), and a median (IQR) of 7 (6–9, T1), 38 (28–48, T2), and 88 (84–100, T3) days post-biopsy. The analytical sample included 370 dd-cfDNA measurements. Clinical follow-up was at a median (IQR) of 185 (172–191) days post-biopsy (T4). Patients with a biopsy of <7 days post- transplantation were excluded from analysis.
Of the 108 allograft biopsies, 36 (33%) were classified as different types of rejection, whereof 7 biopsies were graded as ABMR, 6 as TCMR, and 23 as borderline changes (Figure 1B). Subcategories of ABMR and TCMR with respective dd-cfDNA levels are given in Supplementary Table S1. The 72 biopsies with no signs of rejection were either graded as interstitial fibrosis and tubular atrophy (IFTA, N = 29), polyomavirus nephropathy (BKVAN, N = 13), normal/unspecific (N = 8), or with other changes (N = 22, Figure 1B). Figure 2 displays dd-cfDNA levels, the presence of DSA at an MFI cutoff >500 or >1,000, the presence of any non-HLA antibodies determined, and corresponding histopathological lesions for each biopsy.
FIGURE 2
Patient characteristics stratified for active rejection vs. no rejection are shown in Table 1. Since no protocol but only indication biopsies in the presence of allograft dysfunction had been performed, patients with borderline changes were included into the active rejection group. No statistically significant differences in sex or age were seen between patients with rejection and those without (p > 0.99 and p = 0.1, respectively). Patients with active rejection had significantly higher levels of proteinuria (p = 0.002), and were more likely to be DSA+, albeit without reaching statistical significance (p = 0.07 for DSA with MFI >500, p = 0.31 for DSA with MFI >1,000, Table 1).
TABLE 1
| Variable | Active rejection | No active rejection | p-value |
|---|---|---|---|
| Number of Samples, N (%) | 36 (33) | 72 (67) | |
| Female, N (%) | 12 (33) | 23 (32) | >0.99 |
| Age at enrollment, Median (IQR) | 43 (34–62) | 54 (39–62) | 0.11 |
| Donor type | 0.003 (**) | ||
| Deceased donor, N (%) | 16 (44) | 54 (75) | |
| Living donor, N (%) | 20 (56) | 18 (25) | |
| HLA-A+B mismatches, Median (IQR) | 2 (1–3) | 2 (1–2) | 0.28 |
| HLA-DR mismatches, Median (IQR) | 1 (0–1) | 1 (0–1) | 0.16 |
| Months post-transplant at time of biopsy, Median (IQR) | 36 (3–135) | 28 (3–72) | 0.67 |
| DSA MFI > 500, N (%) | 14 (41)a | 16 (23)b | 0.07 |
| DSA MFI > 1,000, N (%) | 9 (26)a | 12 (17)b | 0.31 |
| Presence of non-HLA AB, N (%) | 7 (19) | 28 (39) | 0.05 |
| sCD30 > 40, N (%) | 11 (31) | 12 (17) | 0.13 |
| S-Creatinine [mg/dL], Median (IQR) | 2.5 (1.7–3.2) | 2.2 (1.8–3.3) | 0.84 |
| eGFR [mL/min/1.73 m2], Median (IQR) | 26.8 (20.6–43.0) | 28.3 (17.4–38.8) | >0.99 |
| Proteinuria [g/molCr], Median (IQR)c | 100.4 (46.4–223.3) | 35.6 (17.5–113.4) | 0.002 (**) |
| dd-cfDNA [%], Median (IQR) | 0.6 (0.2–1.7) | 0.2 (0.1–0.5) | <0.001 (***) |
Clinical characteristics in kidney transplant recipients with indication biopsy stratified for status of rejection.
The data includes two patients with re-biopsies after completed follow-up. dd-cfDNA, donor-derived cell-free DNA; DSA, donor-specific anti-HLA antibodies; non-HLA AB, non-HLA antibodies including antibodies targeting the major histocompatibility complex class I-related chain A (MICA), angiotensin II type 1 receptor (AT1R) and endothelin receptor subtype A (ETA); ***p < 0.001; **p < 0.01.
Not possible to determine DSA in two patients due to missing data.
Not possible to determine DSA in three patients due to missing data.
Data on proteinuria were only available in 29 patients with active rejection and 56 patients without active rejection.
The bold values reflect significance.
Donor-Derived Cell-Free DNA at Time of Biopsy
Patients with histopathological signs of active rejection had significantly higher levels of dd-cfDNA at time of biopsy than patients without signs for rejection, whereas estimated glomerular filtration rate (eGFR) did not differ significantly between the two groups (p < 0.001 and p > 0.99, respectively; Table 1). The diagnosis of active rejection remained independently associated with higher dd-cfDNA levels when stratified for age, gender, BMI, time since transplantation, eGFR, and the presence of donor-specific HLA or non-HLA antibodies (β: −1.071; 95% CI: −1.811, −0.331; p = 0.005; Supplementary Table S2).
dd-cfDNA levels were with a median (IQR) % of 2.00 (0.48–3.20) highest in patients with ABMR, followed by 0.92 (0.19–11.25) in patients with TCMR, 0.44 (0.20–1.10) in patients with borderline changes and 0.20 (0.11–0.53) in patients with no signs of rejection (Figure 3A). Patients with ABMR had significantly higher dd-cfDNA levels compared to both patients without signs of rejection or those with borderline changes (p < 0.001 and p < 0.05, respectively, Figure 3A). dd-cfDNA levels in patients with borderline changes were also significantly higher compared to patients without rejection (p < 0.05, Figure 3A). In contrast, eGFR did not differ significantly between the four groups (Figure 3B).
FIGURE 3
To evaluate the diagnostic performance of dd-cfDNA to discriminate acute rejection from no rejection, the area under the ROC curve (AUC) was calculated. The AUC to discriminate any type of rejection including borderline changes from no rejection was at 0.72 (95% CI 0.62–0.83; Figure 4A). For the discrimination of only ABMR or only TCMR from no rejection, dd-cfDNA exhibited an AUC of 0.90 (95% CI 0.78–1.00, Figure 4B) and 0.73 (95% CI 0.47–0.99, Figure 4C), respectively. When only borderline changes vs. no rejection were compared, a lower AUC of 0.66 (95% CI 0.54–0.79, Figure 4D) was observed.
FIGURE 4
The optimal cut point for dd-cfDNA to discriminate active rejection from no rejection as calculated by the Youden index was at a threshold of 0.57, yielding a specificity of 81% (95% CI 70%–88%), a sensitivity of 53% (95% CI 37%–68%), a PPV of 58% (95% CI 41%–73%), and an NPV of 77% (95% CI 67%–85%). Supplementary Figure S1 displays the values of specificity and sensitivity for different measurements of dd-cfDNA to discriminate acute rejection from no rejection. Table 2 illustrates the specificity, sensitivity, PPV and NPV when applying different dd-cfDNA levels as established in other studies to our study cohort [–].
TABLE 2
| Cut point | Specificity | Sensitivity | Positive predictive value | Negative predictive value |
|---|---|---|---|---|
| dd-cfDNA ≥ 0.5% [] | 74% (95% CI 62%–82%) | 53% (95% CI 37%–68%) | 50% (95% CI 35%–65%) | 76% (95% CI 65%–84%) |
| dd-cfDNA ≥ 0.57% | 81% (95% CI 70%–88%) | 53% (95% CI 37%–68%) | 58% (95% CI 41%–73%) | 77% (95% CI 67%–85%) |
| dd-cfDNA ≥ 0.74% [] | 82% (95% CI 72%–89%) | 48% (95% CI 32%–63%) | 57% (95% CI 39%–73%) | 76% (95% CI 65%–84%) |
| dd-cfDNA ≥ 1% [] | 89% (95% CI 80%–94%) | 44% (95% CI 30%–60%) | 67% (95% CI 47%–82%) | 76% (95% CI 66%–84%) |
Application of suggested cut points of dd-cfDNA levels in our study cohort of kidney transplant recipients with indication biopsy.
In literature, different cutoffs have been proposed for determining when to assume graft injury and/or rejection. Stites et al. found a 0.5% threshold of dd-cfDNA to be associated with increased risk of eGFR decline, DSA development and future episodes of rejection in patients with borderline and 1A T cell-mediated rejection []. Huang et al. introduced a threshold of ≥0.74% for distinguishing between cell-mediated, antibody-mediated, and mixed rejection from cases with no rejection []. Of note, similar to Bloom et al., who advocated for a 1% cut-off, they also excluded patients with borderline lesions from their rejection cohort [, ].
The bold values indicate the cut-off calculated in our study and the respective sens/Spec/PPV/NPV in contrast to other studies.
Twenty-four (22%) patients had dd-cfDNA levels ≥1%, of whom 8 had no histopathological signs of rejection. These patients were diagnosed with BKVAN (N = 1), acute tubular injury (ATI; N = 2; 8 and 11 days after living donor kidney transplantation), IFTA (N = 3, whereof one patient with presence of DSA), or CNI toxicity (N = 2, whereof 1 patient with presence of DSA). Supplementary Figure S2 displays levels of dd-cfDNA in patients with histopathological diagnoses other than rejection.
Donor-Derived Cell-Free DNA in Patients With Borderline Changes
dd-cfDNA levels varied considerably among patients with borderline changes, ranging from 0.06% to 5.80% (Supplementary Figure S3A). When categorizing patients with borderline changes based on their dd-cfDNA levels at time of biopsy (either < or ≥ 1% and < or ≥ 0.5%), those with lower dd-cfDNA levels displayed a tendency toward an improvement in eGFR after corticosteroid pulse therapy, in contrast to patients with higher dd-cfDNA levels who exhibited relatively stable or decreasing eGFR over time, albeit not reaching statistical significance (Supplementary Figure S3B).
Correlation of Donor-Derived Cell-Free DNA to BANFF Lesion Scores
When calculating the relationship between levels of dd-cfDNA to BANFF lesion scores, a significant moderate correlation for dd-cfDNA was established to ptc (44 patients with ptc ≥ 1; Spearman’s rho = 0.34, p < 0.001), and to C4d positivity (4 patients with C4d ≥ 1; Spearman’s rho = 0.30, p = 0.002), and a weak correlation to cg (12 patients with cg ≥ 1; Spearman’s rho = 0.21, p = 0.03) and to PVI (13 patients with PVI ≥ 1; Spearman’s rho = −0.26, p = 0.009) (Supplementary Table S3). The presence of DSA at either cutoff (MFI > 500 or MFI > 1,000) was not significantly associated with higher dd-cfDNA levels, neither was the presence of non-HLA antibodies (Spearman’s rho of −0.19, −0.14, 0.11, respectively). Higher sCD30 levels as a marker of an activated immune system were weakly but significantly associated with higher dd-cfDNA levels (Spearman’s rho = 0.2; p = 0.04). In the presence of DSA, the AUC for discriminating active rejection including borderline changes from no rejection with the help of dd-cfDNA was 0.77 (95% CI 0.60–0.94) when applying a cutoff of MFI > 500 and 0.75 (95% CI 0.53–0.97) when applying a cutoff of MFI>1,000 for determining DSA (Supplementary Figure S4).
Changes in Donor-Derived Cell-Free DNA Upon Treatment
In patients with histopathological signs of ABMR or TCMR, dd-cfDNA decreased significantly when comparing levels at time of biopsy to levels at 7, 30, and 90 days of follow-up (p = 0.04, p = 0.02, and p = 0.002, respectively; Figure 5A). For patients with borderline changes who received corticosteroid pulse therapy (N = 19), dd-cfDNA decreased significantly from a median of 0.4% (0.2–1.1) at time of biopsy to 0.1% (0.1–0.4) 90 days post-biopsy (p = 0.03), whereas no significant differences were seen in eGFR when comparing values obtained at 7, 30, 90, and 180 days follow-up to eGFR at biopsy (Figure 5B). No significant differences in dd-cfDNA levels were observed in patients without histopathological signs of rejection, whereas eGFR improved slightly in these patients from a median (IQR) of 31.9 mL/min/1.73 m2 (21.3–40.5) at biopsy to 33.8 (21.8–42.4) 7 days post-biopsy (p = 0.04; Figure 5C). Supplementary Tables S4, S5 summarize the changes in dd-cfDNA and eGFR post biopsy, respectively, when analyzing pairs.
FIGURE 5
Discussion
In this prospective study, we assessed the diagnostic usefulness of dd-cfDNA in a cohort of German kidney transplant recipients with indication biopsy. We found that dd-cfDNA levels were significantly higher in patients with active rejection compared to patients with no rejection. dd-cfDNA discriminated active rejection (including borderline changes diagnosed during allograft dysfunction) from no rejection with an AUC of 0.72. This is in line with results of Bloom et al. who validated dd-cfDNA in the DART study and found an AUC of 0.74 to discriminate between biopsy showing any rejection (ABMR or TCMR) vs. no histopathological signs of rejection []. When excluding borderline changes from the analysis, the AUC for dd-cfDNA to discriminate ABMR or TCMR from no rejection even reached a higher 0.82, albeit including only a small sample size of 13 patients. Huang et al., who reported on their early clinical experience using dd-cfDNA since it became Medicare reimbursable in the United States in October 2017, reported exactly the same AUC of 0.82 for dd-cfDNA to effectively distinguish ABMR from no rejection []. Thus, it appears that dd-cfDNA performs particularly well in correctly identifying active ABMR which corresponds to our findings of a significant correlation between increased dd-cfDNA levels to ptc lesion score, matching with findings of Gielis et al. []. Since glomerulitis (g) and intimal arteritis (v) were infrequently observed within our cohort, statistical analyses could not be performed for these specific lesions.
Next, we identified that a dd-cfDNA level of 0.57% was best to distinguish rejection (including borderline changes) from no rejection, yielding a specificity of 81%, a sensitivity of 53%, a PPV of 58%, and an NPV of 77%. The cutoffs ≥1.0% and ≥0.74%, as suggested by Bloom et al. [] and Huang et al. [], discriminated active rejection from no rejection in our study with specificities of 89% and 82% and sensitivities of 44% and 48%, respectively. It is evident that specificity increases at higher dd-cfDNA thresholds, however, if we used a cutoff of ≥1%, we would have misinterpreted as many as 56% of the 36 patients (2 patients with ABMR, 3 patients with TCMR, and 15 patients with borderline changes) as having no rejection when relying only on the dd-cfDNA levels. It is crucial to highlight that unlike Bloom et al. and Huang et al. we also incorporated patients with borderline lesions into the rejection group which may account for the lower sensitivity and NPV observed at our calculated 0.57% threshold [, ]. Specifically, 13 out of 23 (57%) patients with borderline lesions had dd-cfDNA levels below this cut-off and were thus “false negative.” In addition, a significant proportion of patients in our study were biopsied at later stages post-transplantation, revealing chronic lesions that were previously shown to be associated with lower dd-cfDNA levels, further impeding sensitivity to correctly identify rejection [].
On the contrary, 8/24 (33%) patients with dd-cfDNA levels of ≥1% had no histopathological signs of rejection but other causes of graft injury, such as ATI, BKVAN, IFTA, or CNI-Toxicity. Regarding higher levels of dd-cfDNA in patients with no molecular or histologic rejection, Halloran et al. argued that dd-cfDNA may also be released if parenchymal injury is present, such as in acute injury or atrophy fibrosis []. The substantial number of patients exhibiting dd-cfDNA levels ≥1% without corresponding histopathological findings for rejection thus emphasizes that dd-cfDNA best serves as an indicator of active graft injury. Evidently, dd-cfDNA cannot differentiate the various causes of acute kidney injury following transplantation, some of which may require opposing treatment approaches. However, as stated by Roy Bloom before, it seems rather unlikely that one biomarker will emerge as a universal solution for diagnosing all kidney transplant-related issues with both high sensitivity and specificity []. A more practical approach would involve utilizing a combination of blood and urine biomarkers alongside various clinical parameters to provide comprehensive insights into cellular damage and immune responses []. Nonetheless, the expanding body of literature on dd-cfDNA underscores its potential in assisting with the identification of at-risk patients in routine clinical practice.
Another potential benefit of dd-cfDNA lies in its ability to identify patients with rejection in whom injury does not resolve upon corticosteroid pulse therapy, warranting closer monitoring, re-biopsies, and possibly more aggressive therapeutic interventions. This hypothesis is supported by Stites et al. who found that higher levels of dd-cfDNA identified patients with TCMR 1A rejection and borderline changes with more unfavorable clinical outcomes, such as eGFR decline, de novo DSA development, and future or persistent rejection []. In our study, we observed considerable variability in dd-cfDNA levels among patients with borderline changes (Supplementary Figure S3). When we categorized these patients into two groups based on their dd-cfDNA levels at the time of biopsy (either <0.5/1% or ≥0.5/1%) and compared their eGFR trajectories, we observed a tendency towards eGFR improvement in patients with lower dd-cfDNA levels whereas patients with higher dd-cfDNA levels showed stable or declining eGFR, although we could not establish statistical significance. When interpreting these findings, one should consider the controversially discussed pathological relevance of borderline changes. Borderline changes with low dd-cfDNA levels may represent non-pathogenic histological findings that may require no treatment at all. However, this hypothesis is to be tested in future studies.
In addition to helping the clinician to identify patients at risk for rejection or with severe injury, dd-cfDNA may also be of use to assess response to therapy. In agreement with the findings of Wolf-Doty et al. and Hinojosa et al., we observed decreasing levels of dd-cfDNA in patients receiving anti-rejection therapy [, ]. However, similar to Wolf-Doty et al., we did not observe any significant changes in eGFR or serum creatinine following treatment []. It is important to exercise caution when interpreting these findings as dd-cfDNA primarily serves as an indicator of injury, whereas eGFR reflects graft function. Since we did not routinely conduct re-biopsies, it remains uncertain whether the injury completely resolved with therapy, which is a limitation to our study.
Another limitation of our study is the relatively small number of cases with ABMR (N = 7) or TCMR (N = 6). However, despite this limitation, our findings align consistently with current literature, supporting the robustness and reliability of the results.
In conclusion, our prospectively designed study verified the good performance of dd-cfDNA to discriminate kidney transplant recipients with active rejection, particularly patients with ABMR, from those with histopathological findings other than rejection. Based on our results, we hypothesize that dd-cfDNA may aid the clinician in monitoring patients at risk, for example, those with de novo DSA or previous biopsy-proven rejection, where elevated or increasing dd-cfDNA levels may aid in decision-making regarding the necessity and timing of a graft biopsy. The potential benefit of dd-cfDNA in the assessment of response to therapy and for risk stratification of patients with borderline changes needs further validation. Additionally, it is yet to be determined whether screening with dd-cfDNA will significantly reduce the number of unnecessary biopsies and can be carried out cost-effectively.
Statements
Data availability statement
The raw data supporting the conclusion of this article will be made available by the authors, without undue reservation.
Ethics statement
The studies involving humans were approved by the Ethikkommission der Universität Heidelberg. The studies were conducted in accordance with the local legislation and institutional requirements. The participants provided their written informed consent to participate in this study.
Author contributions
LB, CM, MZ, and CSü designed the study. LB, CM, and TT analyzed and interpreted the data and drafted the manuscript. LB and MR collected the data. AF established and performed the quantification of dd-cfDNA. CSc and RW were responsible for histopathological classification of biopsy specimens. LB, CM, CSp, FK, CN, JB, and MZ were responsible for clinical management of patients. CM, MZ, CSü, and TT supervised the project and revised the manuscript. All authors contributed to the article and approved the submitted version.
Funding
LB is funded by the Olympia Morata Program of Heidelberg University. CSp is funded by the Physician Scientist Program of the Heidelberg Faculty of Medicine. CSü is funded by the European Union’s Horizon 2020 Research and Innovation Programme (grant no. 952512). For the publication fee we acknowledge financial support by Deutsche Forschungsgemeinschaft within the funding program “Open Access Publikationskosten” as well as by Heidelberg University.
Acknowledgments
We thank Tina Hildenbrand, Evelina Kudlek, and Verena Backendorf at the Department of Immunology for their technical support. The graphical abstract was composed using icons from flaticon.com.
Conflict of interest
This study received funding from CareDx Inc. (Brisbane, CA). The funder had the following involvement with the study: funding for kits and supplies for dd-cfDNA testing.
Supplementary material
The Supplementary Material for this article can be found online at: https://www.frontierspartnerships.org/articles/10.3389/ti.2023.11899/full#supplementary-material
References
1.
Meier-KriescheHScholdJDSrinivasTRKaplanB. Lack of Improvement in Renal Allograft Survival Despite a Marked Decrease in Acute Rejection Rates Over the Most Recent Era. Am J Transpl (2004a) 4:378–83. 10.1111/j.1600-6143.2004.00332.x
2.
Meier-KriescheHScholdJDKaplanB. Long-Term Renal Allograft Survival: Have We Made Significant Progress or Is It Time to Rethink Our Analytic and Therapeutic Strategies?Am J Transpl (2004b) 4:1289–95. 10.1111/j.1600-6143.2004.00515.x
3.
LambKELodhiSMeier-KriescheH-U. Long-Term Renal Allograft Survival in the United States: A Critical Reappraisal. Am J Transpl (2011) 11:450–62. 10.1111/j.1600-6143.2010.03283.x
4.
CoemansMSüsalCDöhlerBAnglicheauDGiralMBestardOet alAnalyses of the Short- and Long-Term Graft Survival After Kidney Transplantation in Europe Between 1986 and 2015. Kidney Int (2018) 94:964–73. 10.1016/j.kint.2018.05.018
5.
MaddenRLMulhernJGBenedettoBJO’SheaMHGermainMJBradenGLet alCompletely Reversed Acute Rejection Is Not a Significant Risk Factor for the Development of Chronic Rejection in Renal Allograft Recipients. Transpl Int (2000) 13:344–50. 10.1007/s001470050712
6.
LoupyAAubertOOrandiBJNaesensMBouatouYRaynaudMet alPrediction System for Risk of Allograft Loss in Patients Receiving Kidney Transplants: International Derivation and Validation Study. Bmj (2019) 366:l4923. 10.1136/bmj.l4923
7.
BloomRDBrombergJSPoggioEDBunnapradistSLangoneAJSoodPet alCell-Free DNA and Active Rejection in Kidney Allografts. J Am Soc Nephrol (2017) 28:2221–32. 10.1681/asn.2016091034
8.
HuangESethiSPengANajjarRMirochaJHaasMet alEarly Clinical Experience Using Donor-Derived Cell-Free DNA to Detect Rejection in Kidney Transplant Recipients. Am J Transpl (2019) 19:1663–70. 10.1111/ajt.15289
9.
StitesEKumarDOlaitanOSwansonSJLecaNWeirMet alHigh Levels of DD-cfDNA Identify Patients With TCMR 1A and Borderline Allograft Rejection at Elevated Risk of Graft Injury. Am J Transpl (2020) 20:2491–8. 10.1111/ajt.15822
10.
BuLGuptaGPaiAAnandSStitesEMoinuddinIet alClinical Outcomes From the Assessing Donor-Derived Cell-Free DNA Monitoring Insights of Kidney Allografts With Longitudinal Surveillance (ADMIRAL) Study. Kidney Int (2022) 101:793–803. 10.1016/j.kint.2021.11.034
11.
RoufosseCSimmondsNGroningenMCHaasMHenriksenKJHorsfieldCet alA 2018 Reference Guide to the Banff Classification of Renal Allograft Pathology. Transplantation (2018) 102:1795–814. 10.1097/tp.0000000000002366
12.
BenningLMorathCKühnTBartenschlagerMKimHBeimlerJet alHumoral Response to SARS-CoV-2 mRNA Vaccination in Previous Non-Responder Kidney Transplant Recipients After Short-Term Withdrawal of Mycophenolic Acid. Front Med (2022) 9:958293. 10.3389/fmed.2022.958293
13.
KühnTSpeerCMorathCBartenschlagerMKimHBeimlerJet alImmune Response to COVID-19 mRNA Vaccination in Previous Nonresponder Kidney Transplant Recipients After Short-Term Withdrawal of Mycophenolic Acid 1 and 3 Months After an Additional Vaccine Dose. Transplantation (2023) 107:1139–50. 10.1097/tp.0000000000004516
14.
CarapitoRAouadiIVerniquetMUntrauMPichotABeaudreyTet alThe MHC Class I MICA Gene Is a Histocompatibility Antigen in Kidney Transplantation. Nat Med (2022) 28:989–98. 10.1038/s41591-022-01725-2
15.
LiuCKangZ-YYinZXiaoYLiuWZhaoYet alLevels of Angiotensin II Type-1 Receptor Antibodies and Endothelin-1 Type-A Receptor Antibodies Correlate With Antibody-Mediated Rejection and Poor Graft Function in Kidney-Transplantation Patients. Transpl Immunol (2022) 74:101674. 10.1016/j.trim.2022.101674
16.
KangZ-YLiuCLiuWLiD-H. Effect of Anti-Angiotensin II Type 1 Receptor Antibodies on the Outcomes of Kidney Transplantation: A Systematic Review and Meta-Analysis. Nephrol Dial Transpl (2021) 37:1171–80. 10.1093/ndt/gfab344
17.
SüsalCDöhlerBSadeghiMSalmelaKTWeimerRZeierMet alPosttransplant sCD30 as a Predictor of Kidney Graft Outcome. Transplantation (2011) 91:1364–9. 10.1097/tp.0b013e31821aba74
18.
MirzakhaniMShahbaziMAkbariRDedinskáINematiEMohammadnia-AfrouziM. Soluble CD30, the Immune Response, and Acute Rejection in Human Kidney Transplantation: A Systematic Review and Meta-Analysis. Front Immunol (2020) 11:295. 10.3389/fimmu.2020.00295
19.
ValkeLLFGCranenbroekBHilbrandsLBJoostenI. Soluble CD30 Does Not Predict Late Acute Rejection or Safe Tapering of Immunosuppression in Renal Transplantation. Transpl Immunol (2015) 32:18–22. 10.1016/j.trim.2014.10.006
20.
GielisEMLedeganckKJDendoovenAMeysmanPBeirnaertCLaukensKet alThe Use of Plasma Donor-Derived, Cell-Free DNA to Monitor Acute Rejection After Kidney Transplantation. Nephrol Dial Transpl (2019) 35:714–21. 10.1093/ndt/gfz091
21.
HalloranPFReeveJMadill-ThomsenKSDemkoZPrewettABillingsPet alThe Trifecta Study: Comparing Plasma Levels of Donor-Derived Cell-Free DNA With the Molecular Phenotype of Kidney Transplant Biopsies. J Am Soc Nephrol (2022) 33:387–400. 10.1681/asn.2021091191
22.
BloomRD. Using (Cell-Free) DNA to Incriminate Rejection as the Cause of Kidney Allograft Dysfunction: Do We Have a Verdict?Am J Transpl (2019) 19:1609–10. 10.1111/ajt.15338
23.
Wolf-DotyTKMannonRBPoggioEDHinojosaRJHillerDBrombergJSet alDynamic Response of Donor-Derived Cell-Free DNA Following Treatment of Acute Rejection in Kidney Allografts. Kidney360 (2021) 2:729–36. 10.34067/kid.0000042021
24.
HinojosaRJChaffinKGillespieMVillarrealVH. Donor-Derived Cell-Free DNA May Confirm Real-Time Response to Treatment of Acute Rejection in Renal Transplant Recipients. Transplantation (2019) 103:e61. 10.1097/tp.0000000000002579
Summary
Keywords
donor-derived cell-free DNA, dd-cfDNA, kidney transplantation, rejection, response to therapy
Citation
Benning L, Morath C, Fink A, Rudek M, Speer C, Kälble F, Nusshag C, Beimler J, Schwab C, Waldherr R, Zeier M, Süsal C and Tran TH (2023) Donor-Derived Cell-Free DNA (dd-cfDNA) in Kidney Transplant Recipients With Indication Biopsy—Results of a Prospective Single-Center Trial. Transpl Int 36:11899. doi: 10.3389/ti.2023.11899
Received
07 August 2023
Accepted
23 October 2023
Published
03 November 2023
Volume
36 - 2023
Updates
Copyright
© 2023 Benning, Morath, Fink, Rudek, Speer, Kälble, Nusshag, Beimler, Schwab, Waldherr, Zeier, Süsal and Tran.
This is an open-access article distributed under the terms of the Creative Commons Attribution License (CC BY). The use, distribution or reproduction in other forums is permitted, provided the original author(s) and the copyright owner(s) are credited and that the original publication in this journal is cited, in accordance with accepted academic practice. No use, distribution or reproduction is permitted which does not comply with these terms.
*Correspondence: Louise Benning, louise.benning@med.uni-heidelberg.de
Disclaimer
All claims expressed in this article are solely those of the authors and do not necessarily represent those of their affiliated organizations, or those of the publisher, the editors and the reviewers. Any product that may be evaluated in this article or claim that may be made by its manufacturer is not guaranteed or endorsed by the publisher.