Abstract
The decline in soil productivity due to intensive cultivation, unbalanced fertilization and climate change are key challenges to future food security. There is no significant research conducted on the effect of organic amendments on soil properties and active carbon fractions in organic-matter deficient soils under changing climate. Biochar (BC) is a stabilized organic amendment produced from organic materials and is increasingly recognized as being able to improve soil health and crop productivity. The present study was conducted to determine the efficacy of compost (CM) (0.5%, 1%) (w/w) and animal manure (AM) (0.5%, 1%) (w/w) alone and combined with 3% (w/w) biochar, on soil carbon fractions, soil properties, and crop growth in a low-fertile soil. The results revealed significant increased 46% plant height, 106% and 114% fresh and dry shoot weight respectively, and 1,000-grain weight increased up to 40% when 3% BC with 1% CM was applied, compared to a control. Similarly, substantial increases in 69% soil organic matter, and 70% carbon pool index were observed at 3% BC, and under 3% BC with 1% CM increased 11% microbial biomass carbon compared to the control. Overall, the results suggest that 3% BC addition along with 1% CM and AM (1%) had greater potential to improve the soil carbon pool, microbial biomass, and soil health, all of which will ultimately enhance maize yield when grown in low-fertility soil. The application of BC, CM, and AM are a viable green approach, that not only boosts crop yields and improves soil properties and but also contributes to a circular economy.
Introduction
Soil is a non-renewable resource that performs a vital role in ecosystem services and acts as a medium for plant growth by providing essential nutrients, water, gaseous exchange, and as an environmental buffer, facilitating degradation and the reduction of natural and xenobiotic toxic substances (Amoakwah et al., 2020). Intensive cultivation, together with injudicious fertilization and poor cropping practices, results in declining soil health and crop productivity, thereby threatening future food security (Naeem et al., 2018). This situation is further accelerated due to soil erosion, salinization, and desertification, which leads to soil organic carbon loss, loss of microbial biodiversity and, ultimately, loss of crop productivity (Gregory et al., 2015). Similarly, poor management practices, such as indiscriminate ploughing and burning or the complete removal of crop residues, will further worsen soil organic matter (SOM) degradation and deteriorate soil quality (Lal, 2015). The loss of SOM through microbial degradation depletes the organic carbon pool, microbial biodiversity, and increases greenhouse gases (GHG) emissions (Shakoor et al., 2020). This situation demands more suitable strategies to help ensure sustained soil health and crop production in an eco-friendly manner. Synthetic fertilizers are used to boost crop yields, but the continuous use of these fertilizers will lead to soil degradation and the contamination of water bodies, which is another significant concern (Haider et al., 2021). Low organic-matter content in calcareous soils leads to lower nutrient availability and the loss of biological activity. Soil quality can be restored through proper management practices that enhance SOM content and improve microbial biodiversity and soil properties, thereby improving its productivity (Shakoor et al., 2020; Haider et al., 2021). It has been established that the addition of organic amendments to soil resulted in a higher SOM content, which serves as the storehouse for many other plant nutrients (Srivastava et al., 2020). Labile organic carbon (LOC) is highly active part of SOM that decomposes abruptly after its application to soil and is vital to the soil food web (Adnan et al., 2020). It is well known that the direct addition of organic amendments (OAs) increases organic carbon (OC) stock, provides food to microbial communities, increases nutrient (nitrogen, potassium, phosphorus, calcium, and magnesium) availability, prevents erosion, improves soil aeration and soil structure, and decreases soil crusting and bulk density (Obalum et al., 2017).
Traditionally, animal manure (AM), mulches, and other organic wastes re-used as soil conditioners, and have been recognized as effective means for improving nutrient supplies to crops and microbial activity in soils (Kamara et al., 2015). The AM is a rich consortium of plant-available nutrients, that reduce bulk density, and improve soil aeration, aggregate stability, crop production, and organic carbon reserve in soil but also affects GHGs emissions (Zhou et al., 2017). However, there are some drawbacks associated with the direct application of these OAs including, but not limited to, fast decomposition and quick release of nutrients, which results in nutrient leaching and contributes to eutrophication and GHG emissions (Sutton et al., 2014; Urra et al., 2019). Composting is another technique in which organic waste (plant leaves and twigs, food scraps, manure or sewage) is converted into a stable form and remains in the soil for a period of time than untreated organic wastes and compost application to soil improves nutrient availability, aeration, and reduced bulk density, and thus enhances soil structure but it also contains heavy metals (Al-Omran et al., 2019; Niamat et al., 2019). Because of the usage of animal wastes, biowastes, and biosolids used in composting can include metals and antibiotics. Compost, biosolids, and biowastes are used as soil amendments, and long-term usage of these products may result in heavy metals build-up in soil and antibiotic resistant in the environment (Arya et al., 2021; Peng et al., 2021) which may contaminate soil and water bodies through runoff and leaching, thus limiting the long-term use of compost (Lillenberg et al., 2010). Therefore, these raw organic materials must first be processed before direct application to soil, and the conversion of readily decomposed AOs into BC is another attractive alternative approach for addressing these challenges (Rahman et al., 2020).
Biochar (BC) is a black carbonaceous material produced through pyrolysis, which is the thermal decomposition of organic materials in the absence of oxygen (Zhang et al., 2019). In this regard, a variety of feedstock, such as agricultural wastes (tree leaves, twigs, bark, straw, bagasse, husks, nutshells, corncob, and corn stalks etc.), animal and bird waste (animal beds and manure), industrial waste (bagasse and grain) have been extensively used for BC production (Novotny et al., 2015; Azeem et al., 2020; Naveed et al., 2020). In recent decades, the application of BC to combat low soil fertility and climate change has aroused the interest of many scientists due to its ability to improve soil health, bio-energy generation, carbon sequestration, and the immobilization of inorganic and organic pollutants (Rehman et al., 2016). The addition of BC to soil also improves soil water and nutrient retention capacity, soil aeration and soil structure, and enhances nutrient availability to plants, which ultimately increases plant growth and yield (Singh et al., 2019). Moreover, the incorporation of BC into soil positively impacts carbon sequestration, reduces greenhouse gas (GHG) emissions, and increases carbon pools by altering microbial community composition and providing substrates to microbes, and resistant to decomposition (Hui, 2021). Its porous nature and large surface area provide habitats to soil microbes under stress, as the ash content in BC delivers nutrients to plants and microbes (Kocsis et al., 2022). Combing BC with CM not only improve composting efficiency and end-product quality and stabilize nutrient release from CM or AM from long time, but also increased BC surface area and retain nutrient release (Rivelli and Libutti, 2022). Application of such amendments in calcareous soils not only improve soil properties and nutrient availability but also significantly enhances organic carbon in soil (Abrar et al., 2020). Moreover, the recalcitrance nature of BC and its long-term soil stability are its main advantages over other OAs (Nguyen et al., 2018). In previous studies, several authors only tested the application effects of BC, CM or AM on crop growth and soil health. However, few researchers have investigated the impact of combined application of BC, CM or AM on crop growth and yield in nutrient-depleted soils (Lashari et al., 2015; Sánchez-García et al., 2016; Singh et al., 2019; Abbas et al., 2020; Pandit et al., 2020).
There are various areas where research on OAs requires further exploration, and the major knowledge gap regarding the combined impacts and application rates of BC, CM, and AM on active soil components and the carbon management index. We hypothesized that BC application CM or AM will increase the active portions of soil carbon, including microbial biomass carbon (MBC) and total carbon (TC) contents in organic-matter deficient soil. This is because different OA have different rates of decomposition and nutrient release, and by combining it could lead to a more sustained improvement in soil properties over time. Additionally, more research is needed for long time effects of these amendments on soil properties in organic-matter deficient soil. The current study especially aims to evaluate the cumulative impacts of BC, CM, and AM on maize productivity, nutrient absorption, soil properties, and the carbon management index under organic matter deficient soil.
Materials and Methods
Biochar and Compost Preparation and Characterisation
Corncob biochar (BC) was prepared from corncob feedstock at 350 using muffle furnace (Gallon Hop, England). Feedstock was filled in pyrex flask having 2 L capacity and bear temperature up to 1,000°C. Silicon grease was used to prevent oxygen entering the flask, and the flask outlet was attached to a bended glass rod to remove water vapours and gasses from the furnace and work area. Feedstocks were collected from the agronomy research field at the University of Agriculture, Faisalabad (UAF), washed to remove dust and other impurities, sun-dried to remove moisture, and crushed into 2–5 mm sized particles for biochar preparation. Sánchez et al. (2009) described procedure was followed for biochar preparation. During pyrolysis, furnace temperature was gradually increased by 15 min−1 and 30-min residence time was adjusted after attaining a maximum temperature of 350. The furnace was then allowed to cool until the temperature dropped to 20 After that the lid was removed and prepared BC was collected and stored in plastic bag for further analysis.
Animal manure was collected from the animal husbandry farm of UAF, Pakistan. The collected AM was then dried, crushed, and stored for future use. The compost was prepared from vegetables and fruit waste in a locally fabricated composter unit. The fruit and vegetable waste were collected from a local market and sun-dried to remove extra moisture, unwanted stones, and plastic materials and oven dried for 24 h to reduce the water content by up to 15% and then crushed with a grinder. The ground material was transferred to the composter for compost preparation. For proper composting, a 40% moisture level was constantly maintained, and the composter was rotated at 50 rpm until an odourless dark-brown colour compost was obtained (Naveed et al., 2021).
The physiochemical properties of OAs were shown in (Table 1). Electrical conductivity (EC) and pH were measured using a soil: water (1:20) suspension (Abbas et al., 2020; Naveed et al., 2021). The NH4-acetate method was used for determination of cation exchange capacity (CEC) (Gaskin et al., 2010), total organic carbon was determined using a total organic carbon (TOC) analyser [TRL-TOC, Turkey] (Aziz et al., 2021). Wet digestion method was used for N, P, and K in which 0.5 g of sample was digested with 10 mL H2SO4 and add 2 mL H2O2 and heated till clears solution was obtained (Wolf, 1982). After digestion, the samples were stored for testing. The total nitrogen was measured using the Kjeldahl method and the flame photometer (PFP7, Jenway, Essex, UK) was used to calculate K, while the spectrophotometer (UV-1201, Shimadzu, Tokyo, Japan) was utilized to assess P using the vanadate-molybdate procedure following ICARDA, 2013 (Estefan et al., 2013).
TABLE 1
| Characteristics | Units | Soil | CM | BC (350°C) | AM |
|---|---|---|---|---|---|
| pH | 7.94 ± 0.02 | 7.53 ± 0.01 | 6.97 ± 0.01 | 8.0 ± 0.06 | |
| EC | dS m−1 | 1.12 ± 0.02 | 3.08 ± 0.02 | 0.87 ± 0.01 | 4.04 ± 0.09 |
| CEC | cmolckg−1 | 6.12 ± 0.01 | 19.6 ± 0.87 | 41.2 ± 0.57 | 12.13 ± 0.55 |
| OC | % | 0.61 ± 0.01 | 38.9 ± 0.61 | 56.57 ± 0.84 | 38.6 ± 0.78 |
| Total N | % | 0.04 ± 0.00 | 1.48 ± 0.02 | 1.46 ± 0.04 | 1.14 ± 0.06 |
| Exchangeable P | mg kg−1 | 4.63 ± 0.20 | 0.31 ± 0.01 | 0.46 ± 0.03 | 0.42 ± 0.02 |
| Extractable K | mg kg−1 | 117 ± 1.31 | 1.67 ± 0.04 | 1.07 ± 0.03 | 0.91 ± 0.1 |
| Yield | % | -- | -- | 49.27 ± 0.99 | -- |
| Ash content | % | -- | -- | 14.3 ± 0.41 | -- |
| C/N Ratio | 13.93 ± 0.22 | 41.47 ± 1.24 | 13.73 ± 0.93 | ||
| Textural class | -- | Sandy clay loam | -- | -- | -- |
Characterization of soil, CM, BC, and AM used in the experiment.
Data is an average of three replicates ± SD.
Experimental Design
A pot study was conducted at Soil Science Research Station, University of Agriculture Faisalabad in a wire house under natural conditions. For this purpose, the soil was collected from the Soil Science research field (31.439082° N, 73.069365° E) and sieved with a 2 mm sieve to remove plant roots, stones, and other unwanted particles. The soil was homogenized, and 30 plastic pots (width 1.5 ft., height 2.5 ft.) were filled with soil, and each pot contained 18 kg soil and recommended NPK (220:160:120 kg ha−1) fertilizers were mixed into the soil, comprising urea, diammonium phosphate, and sulphate of potash. Ten different treatments; T0 (CK): control; T1 (CM-0.5): compost 0.5%; T2 (CM-1): CM 1%; T3 (BC-3): BC 3%; T4 (BC-3+CM-0.5): BC 3% + CM 0.5%; T5 (BC-3+CM-1): BC 3% + CM 1%; T6 (AM-0.5): AM 0.5%; T7 (AM-1): AM 1%; T8 (BC-3+AM-0.5): BC 3% + AM 0.5%; and T9 (BC-3+AM-1): BC 3% + AM 1% were applied under completely randomized design (CRD) with three replications of each treatment. Maize (variety FH-1046) was obtained from the Maize Research Station, Ayyub Agricultural Research Institute, Faisalabad, Pakistan, and used as a test crop and 4 seeds were sown in each pot at field capacity. Pots were kept under polythene sheet covered wire house to prevent rain and animal attack. The pots were watered with water bucket as needed during the entire growth period.
Soil Analysis
After soil homogenisation, soil samples were collected in plastic bags for basic soil analysis. Soil pH was measured with a pH meter (JENCO Model- 671 p) after making saturated soil paste (Schofield and Taylor, 1955). Soil texture was determined using the hydrometer method (Bouyoucos, 1962). Soil moisture contents, CEC and extractable K were measured using standard procedure (United States Salinity Laboratory Staff. 1954). Walkley, (1947) described method was used for SOM determination in which 1 g of soil mixed with 5 mL K2Cr2O7 and 10 mL H2SO4 was added and allowed the flask to stand for 30 min to cool and add 100–150 mL distilled water. After that 3 mL of orthophosphoric acid (H3PO4), 5–10 drops of indicator, and titrate it against standardized ferrous sulphate to bright green endpoint. Total N was measured using Kjeldahl method (Bremner, 2016), and exchangeable P was measured in which 2.5 g of soil was treated with 0.5 M NaHCO3 extracting solution and shake for 30 min and filtration. Pipette out a 5 mL aliquot in a 25-mL volumetric flask, and 5 mL of colour development reagent. The intensity of the blue colour is measured with 880 nm wavelength using spectrophotometer (Olsen et al., 1954).
Agronomic Parameters
The maize was harvested at zodiac stage (R6). To assess maize growth and yield, plant height and cob length were recorded using scale, shoot fresh biomass after harvest and dry biomass and total grain weight were weighted using weighing balance.
Measurement of Physiological Parameters
Infrared gas analyzer (IRGA, LCA-4, ADC, Hoddesdon, UK) was used for physiological parameters measurement. Photosynthetic rate, transpiration rate (Tr), water use efficiency (WUE) and stomatal conductance (SC) (Ben-Asher et al., 2006). The SPAD-502 (Minolta, Osaka, Japan) was used to determine chlorophyll contents in the leaves (Wellburn, 1994). Relative water content (RWC) was measured by taking a fully expanded leaf from an individual replicate. The fresh weight of the leaf was recorded after being washed with distilled water. The leaf samples were placed in test tubes containing 10 mL distilled water for 4 h. Turgid weight was recorded after 4 h. Samples were oven dried for 72 h. The RWC was calculated using the formula established by Mayak et al. (2004).
Membrane Stability Index
For measuring the membrane stability index, a fully matured younger leaf was put into a test tube containing 10 mL of distilled water. Samples were heated in a water bath for 30 min at 40°C, and then electrical conductivity (EC1) was recorded. The plant samples were heated again in the water bath at 100°C for 10 min, and then EC2 was recorded. The membrane stability index (MSI) was calculated using the formula (Sairam et al., 2002).
Plant Analysis
The plant samples were ground, sieved with 2 mm sieve after drying and used for further analysis. For plants nitrogen, each finely powdered sample was digested using concentrated sulphuric acid (H2SO4) and hydrogen peroxide (H2O2) using the Wolf (1982) method for digestion. Distilled water was used for making the volume accordingly after cooling, followed by filtration. Total nitrogen (TN) was estimated through the Kjeldahl apparatus. Total P was determined using a spectrophotometer (Milton Roy Company, United States), and total K was analysed using flame photometer (Jenway PFP-7, UK) (United States Salinity Laboratory Staff. 1954).
Post-Harvest Soil Analysis
At the end of the experiment, soil samples were collected and air-dried for 72 h. Soil pH, CEC and SOC were measured using United States Salinity Laboratory Staff. 1954. The results of these analysis are presented in Figures 1–3.
FIGURE 1
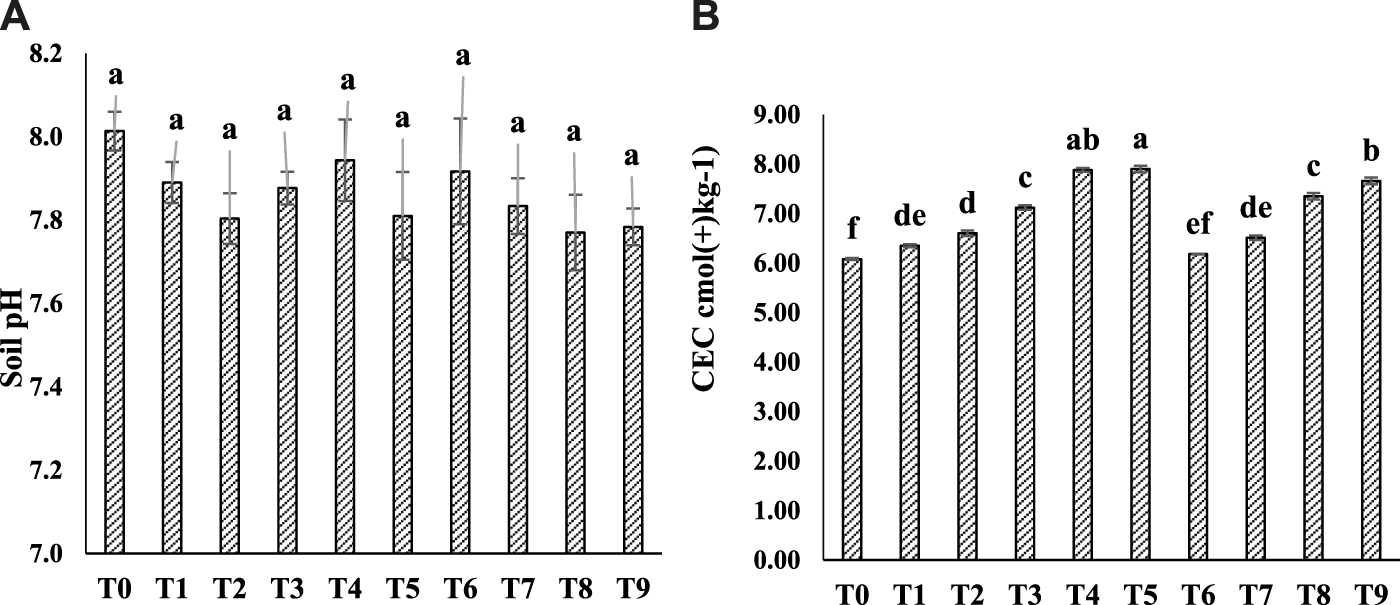
Effect of CM, BC, and AM on soil pH (A) and CEC (B) after crop harvesting. Data is an average of three replicates and similar letter(s) in a graph shows non-significant results at (p = 0.05). Note: T0 = Ck T1 = CM-0.5, T2 = CM-1, T3 = BC-3, T4 = BC-3+CM-0.5, T5 = BC-3+CM-1, T6 = AM-0.5, T7 = AM-1, T8 = BC-3+AM-0.5, and T9 = BC-3+AM-1.
FIGURE 2
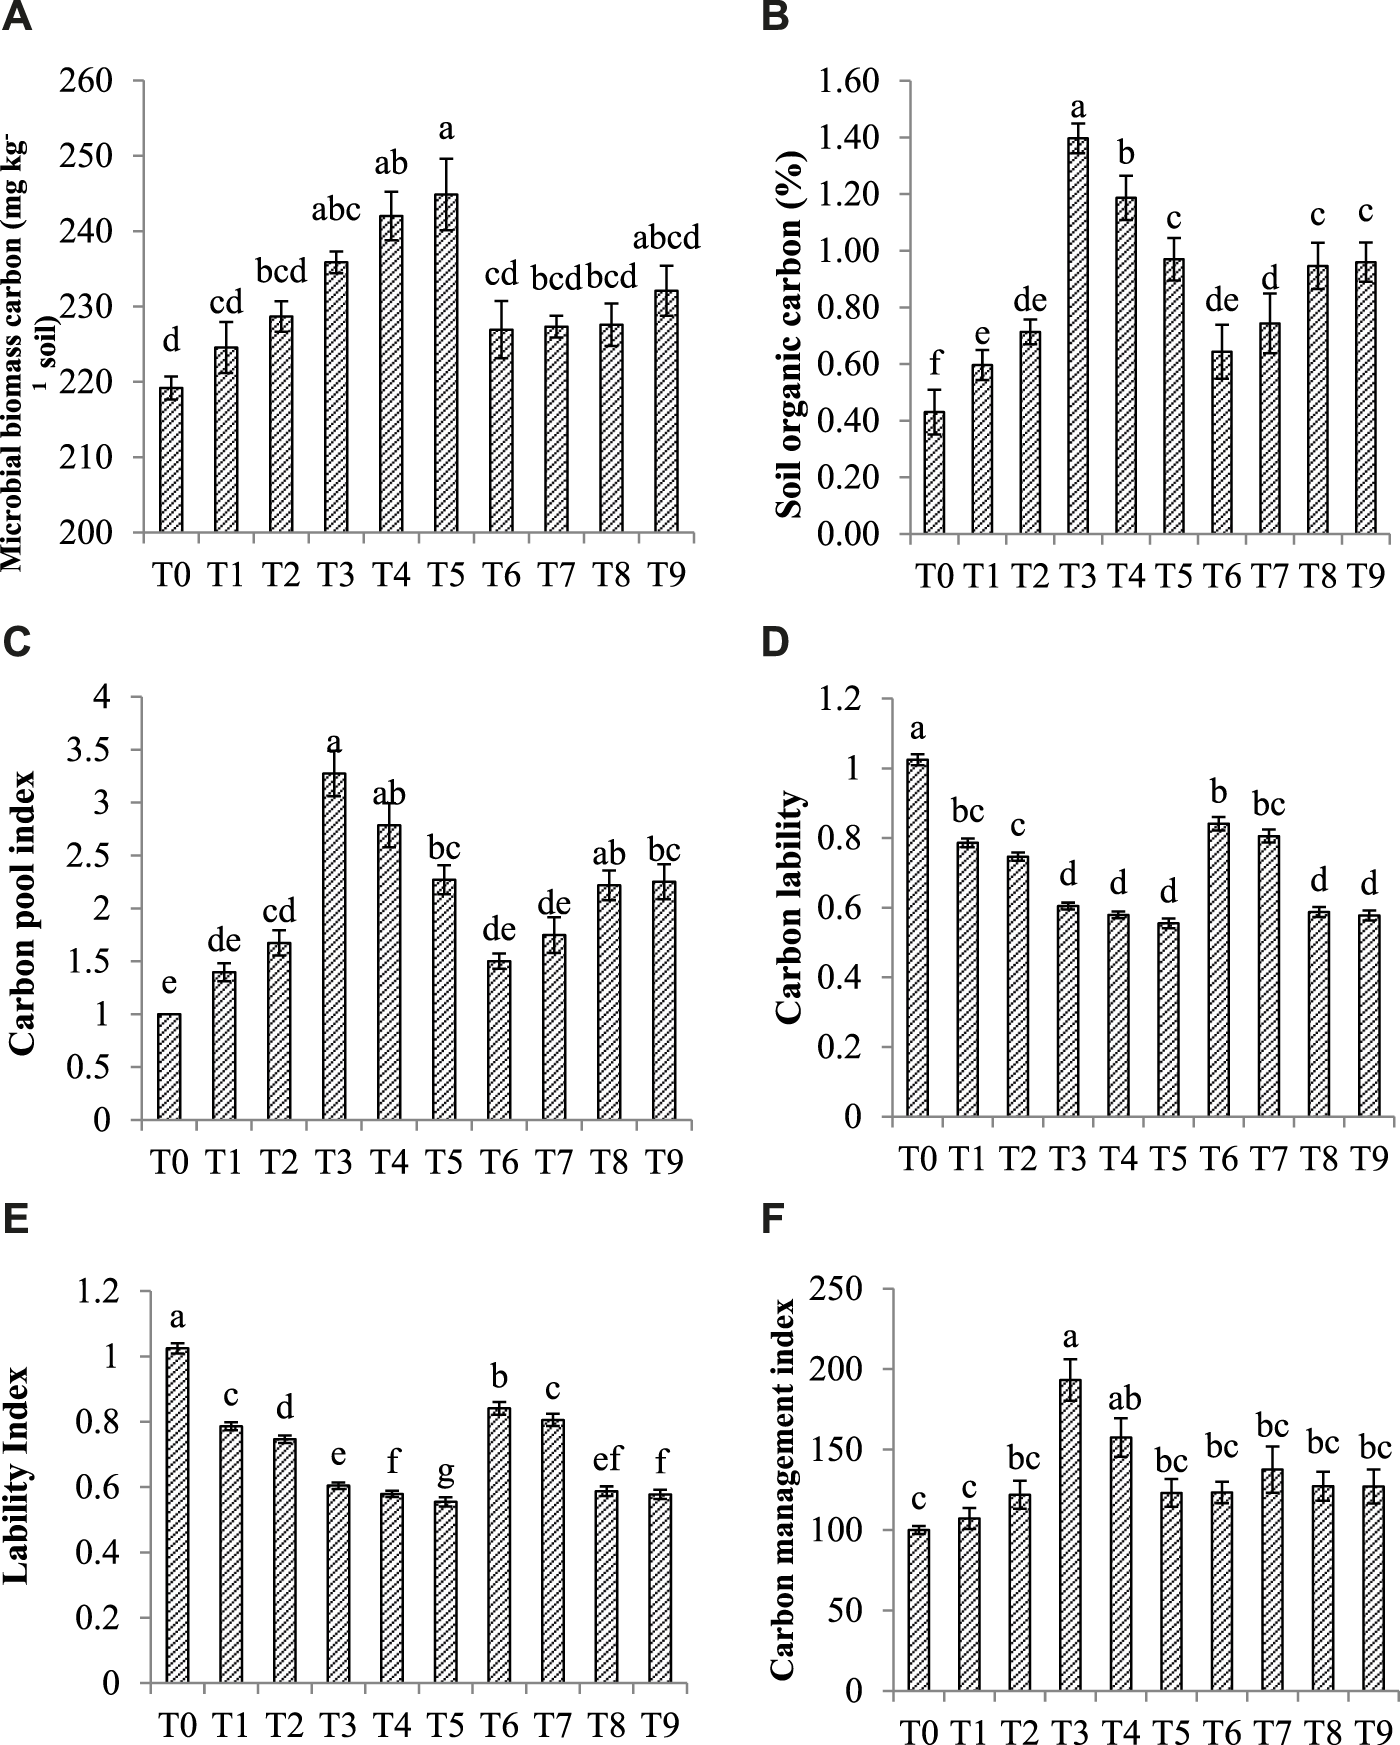
Effect of CM, BC, and AM (A) Microbial biomass carbon (B) Soil organic carbon (C) Carbon pool index (D) Carbon lability (E) Lability Index (F) Carbon Management index. Data is an average of three replicates and similar letter(s) in a graph shows non-significant results at (p = 0.05). Note: T0 = Ck T1 = CM-0.5, T2 = CM-1, T3 = BC-3, T4 = BC-3+CM-0.5, T5 = BC-3+CM-1, T6 = AM-0.5, T7 = AM-1, T8 = BC-3+AM-0.5, and T9 = BC-3+AM-1.
FIGURE 3
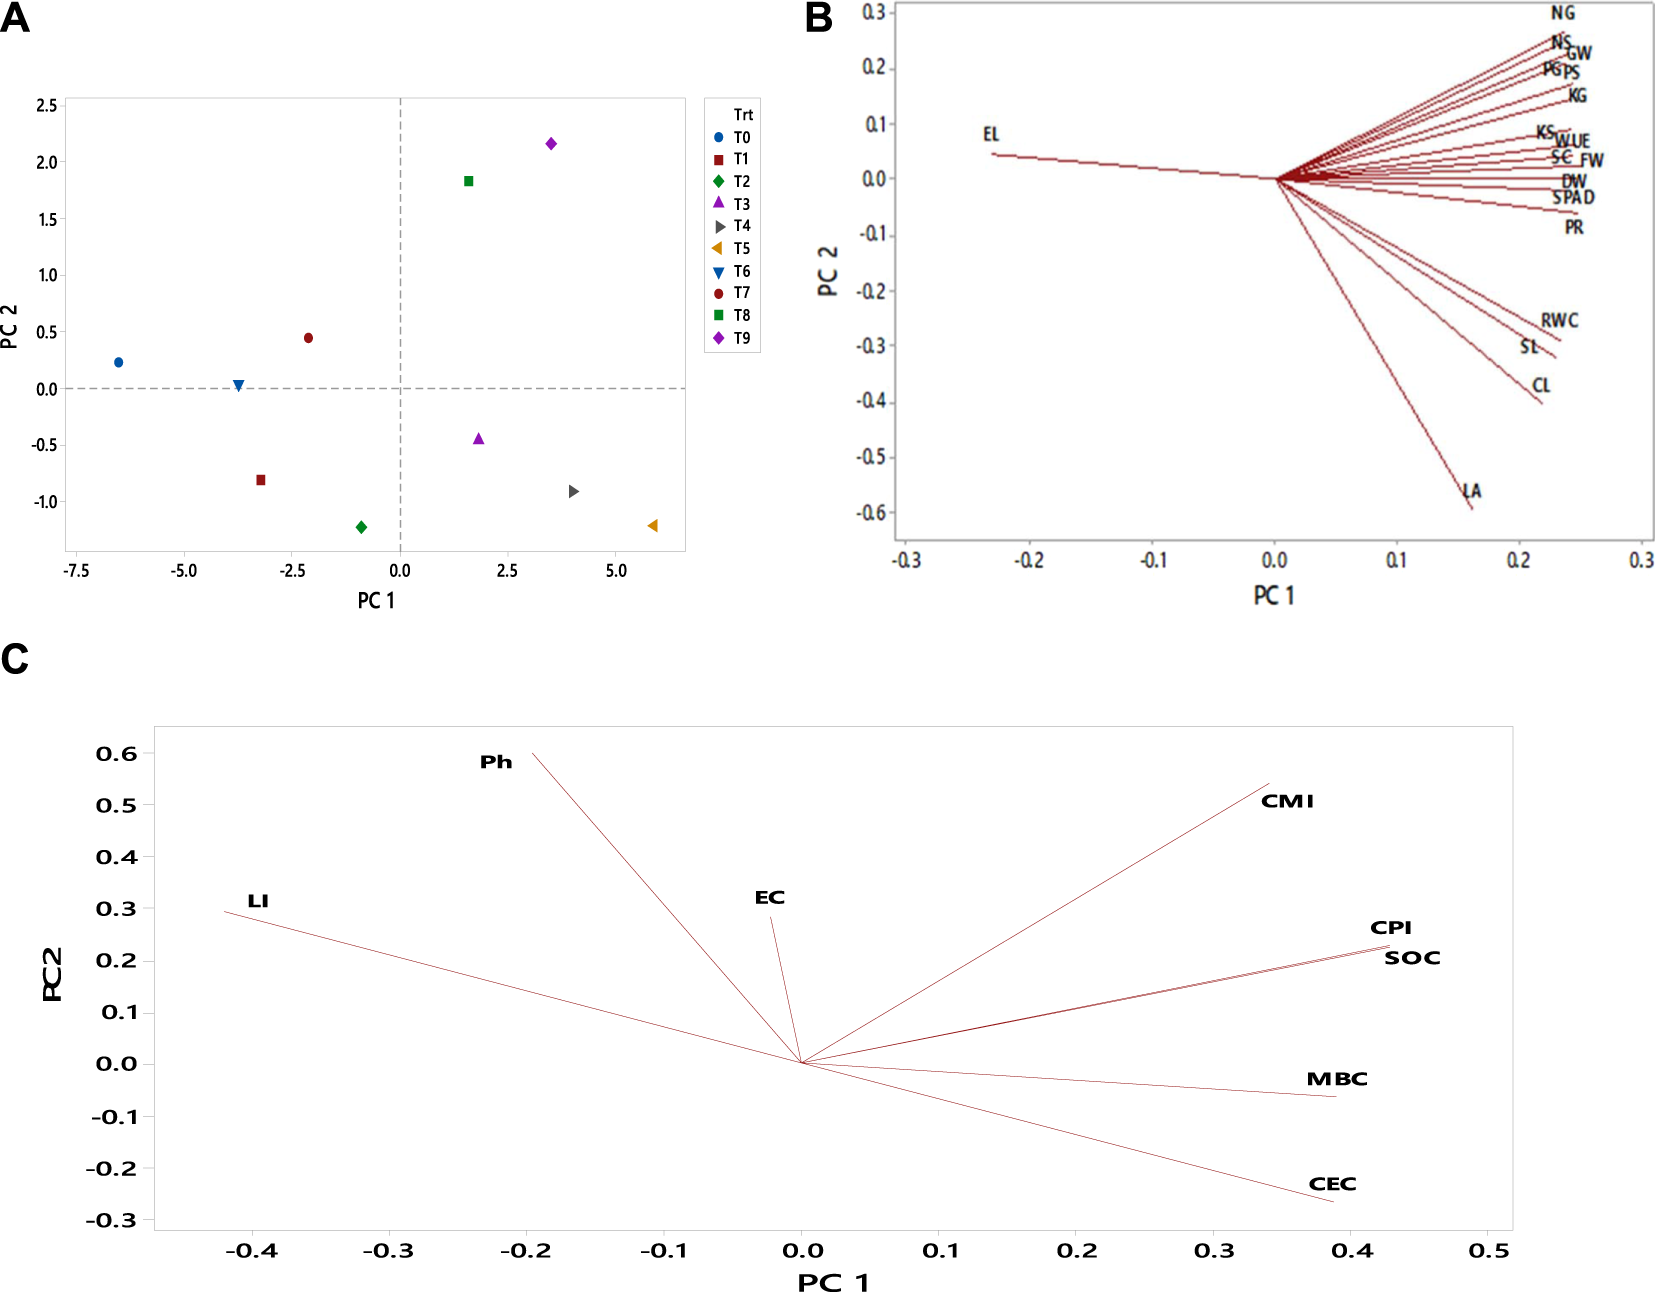
Principal component analysis (PCA) performed on different maize growth, physiological and soil parameters. (A) represents PCA among treatments, (B) depicts the PCA among different growth and physiological parameters, and (C) showed PCA among soil parameters, The abbreviations are as FW, fresh weight; DW, dry weight; L, shoot length; CC, chlorophyll contents; EL, electrolyte leakage; LA, leaf area, RWC, relative water content; Ph, soil Ph; EC, electrical conductivity; CEC, cation exchange capacity; CL, cob length; GW, grain weight; PR, photosynthetic rate; WUE, water use efficiency; SC, stomatal conductance; GN, grain nitrogen; GP, grain phosphorus; GK, grain potassium; SN, straw nitrogen; SP, straw phosphorus; SK, straw potassium; SOC, soil organic carbon; CPI, Carbon pool index; LI, Lability Index; and CMI, carbon management index. Note: T0 = Ck T1 = CM-0.5, T2 = CM-1, T3 = BC-3, T4 = BC-3+CM-0.5, T5 = BC-3+CM-1, T6 = AM-0.5, T7 = AM-1, T8 = BC-3+AM-0.5, and T9 = BC-3+AM-1.
Microbial Biomass Carbon and Microbial Biomass Nitrogen Determination
A chloroform fumigation-extraction procedure was followed for microbial biomass carbon (MBC) and microbial biomass nitrogen (MBN) estimation in soil (Brookes et al., 1985). Two different crucibles containing 10 g of moist soil were placed in separate desiccators, one with 30 mL alcohol-free chloroform (CHCl3) and another without CHCl3, covered and placed at room temperature for 5 days (Anderson, 1993). After soil fumigation, a 50 mL K2SO4 (0.5 M) solution was added and shaken for 30 min at 200 rpm arbitral shaker speed to extract MBC and MBN from lysed microorganisms and then filtered. The MBC was measured on a spectrophotometer (ultraviolet-visible [UV-VIS]/1,201, Shimadzu) at 600 nm, while the Kjeldahl method was used for MBN determination. Both MBC and MBN were calculated using previously determined equations (Sparling and West, 1988).where Ec was extracted, C was a result of fumigation and k was the biomass fraction, which was 0.35 for C and 0.45 for N (Ross and Täte, 1993).
Carbon Management Index
Based on the variations in total carbon in the soil environment and its lability (as determined by the oxidation of KMnO4), the carbon management index (CMI) was calculated (Blair et al., 1995). The carbon pool index (CPI) was calculated according to changes in the TOC of the control and the treatments.
The lability of carbon (L) was calculated according to the fraction of carbon oxidised KMnO4.
Based on the changes in the proportion of labile carbon, the lability index (LI) was calculated as follows:
The CMI was calculated using two indices (CPI and LI) as follows:
A higher CPI (>1) indicated a greater accumulation of organic carbon, and a lower CPI (<1) reflected lower carbon accumulation. Similarly, a higher LI (>1) indicated a higher labile organic carbon content. In contrast, a lower LI (<1) indicated a lower organic carbon content. The CMI served as the expression of soil quality in increments of total carbon and the portion of labile carbon fractions compared to a control (CMI = 100); CMI>100 reflected an increased soil carbon content.
Statistical Analysis
All data were statistically analyzed using Statistix 8.1® (Analytical Software, Tallahassee, FL, United States) under completely randomized design (CRD) with three replications. The data were analyzed using one-way ANOVA and interpreted using Tukey multiple comparison test to compare mean values (p < 0.05) (Steel et al., 1997). The influence of several treatments on various physicochemical and biological parameters of the modified soil was investigated using correlation and principal component analysis (PCA) in Mini-Tab 18.1.0.
Results
The Effect of CM, BC, and AM on Postharvest Soil Properties
Physicochemical parameters of CM, BC, and AM and soil used in this study are shown (Table 2). The highest soil pH (8.0 ± 0.05) was observed in Ck. The addition of BC with CM and AM fluctuate soil pH for a short time, but the decrease was not significant shown in Figure 1A. The lowest pH (7.8 ± 0.04) was observed under BC-3+AM-1 treatment, in which 0.2-unit decrease was noted over Ck. A significant increase in soil CEC were observed where BC-3+CM-0.5 and BC-3+CM-1 were used (Figure 1B) and the maximum 31% increase in soil CEC was observed under BC-3+CM-1 as compared to Ck.
TABLE 2
| Treatments | SL (cm) | SFW/pot (g) | SDW/Pot (g) | LA | CL (cm) | 1000 GW(g) |
|---|---|---|---|---|---|---|
| T0 | 84 ± 6.99f | 124 ± 9.75f | 44 ± 1.89f | 198 ± 24.79f | 3.6 ± 0.36e | 299.0 ± 11.2e |
| T1 | 104 ± 4.29de | 157 ± 15.61ef | 52 ± 2.52e | 246 ± 30.55def | 4.5 ± 0.50cde | 326.1 ± 23.4e |
| T2 | 116 ± 9.17cd | 186 ± 5.05de | 73 ± 2.52d | 299 ± 41.56dcd | 4.9 ± 0.60bcd | 345.6 ± 32.9cde |
| T3 | 124 ± 3.95bc | 209 ± 8.54bcd | 88 ± 2.78c | 326 ± 6.53abc | 5.3 ± 0.29abc | 394.9 ± 31.6abcd |
| T4 | 136 ± 3.08b | 226 ± 16.78abc | 96 ± 2.47b | 353 ± 12.27ab | 5.8 ± 0.29ab | 397.9 ± 14.1abcd |
| T5 | 156 ± 5.19a | 257 ± 10.33a | 114 ± 2.86a | 362 ± 11.82a | 6.2 ± 0.29a | 411.8 ± 10.0ab |
| T6 | 90 ± 3.97ef | 155 ± 9.10ef | 46 ± 3.50ef | 213 ± 11.27ef | 3.8 ± 0.21de | 339.2 ± 35.0de |
| T7 | 100 ± 12.3def | 170 ± 14.13e | 53 ± 2.65e | 269 ± 26.46cde | 4.3 ± 0.29cde | 351.3 ± 18.4bcde |
| T8 | 108 ± 2.93cd | 203 ± 12.72cd | 88 ± 2.52c | 303 ± 12.71abcd | 4.4 ± 0.53cde | 405.3 ± 13.2abc |
| T9 | 116 ± 5.55cd | 239 ± 7.53ab | 96 ± 1.61b | 323 ± 10.83abc | 4.7 ± 0.29dec | 418.9 ± 11.0a |
Effect of CM, BC, and AM on growth and yield parameters of maize.
SL, shoot length; SFW, shoot fresh weight; SDW, shoot dry weight; LA, leaf area; CL, cob length; 1000 GW, 1,000 grain weight. Data is an average of three replicates ± SD and similar letter(s) in a column shows non-significant results at (p = 0.05). Note: T0 = Ck T1 = CM-0.5, T2 = CM-1, T3 = BC-3, T4 = BC-3+CM-0.5, T5 = BC-3+CM-1, T6 = AM-0.5, T7 = AM-1, T8 = BC-3+AM-0.5, and T9 = BC-3+AM-1.
Effect of CM, BC, and AM on Soil Quality Parameters
Data concerning MBC, SOC, CPI, LI, and CMI are shown in Figures 2A–F. The maximum 11% MBC increase was recorded where BC-3+CM-1 was used as compared to Ck (Figure 2A). The Figure 2B data revealed that the maximum 69% SOC increase was noticed under BC-3 while BC-3+CM-0.5 and BC-3+CM-1enhanced SOC up to 64% and 56% respectively.
The data (Figure 2C) showed the maximum increase in CPI was 69% with BC-3 as compared to control. The addition of CM-1+BC-3 improved the CPI up to 56%, and a similar result was observed following the addition of AM-1+BC-3. Significant decrease in labile carbon was observed with the addition of BC with other OAs (p < 0.05) and the maximum reduction in labile carbon 46% under BC-3+CM-1 (Figure 2D).
The maximum reduction was 76%, 84% and 77% in LI was recorded with BC-3+CM-1, BC-3+AM-0.5 and BC-3+AM-1 which was non-significant when compared to each other (Figure 2E). Similarly, the maximum increase was 48% in CMI observed where BC-3 was applied (Figure 2F).
Effect of CM, BC, and AM on Plant Growth, Cob Length and 1,000 Grains Weight
Table 3 data showed the CM, BC, and AM effect on SFW, SDW, LA, and PL. The application of BC-3+CM-1 increased plant height by 46% as compared to control. The maximum 106% SFW increase was noticed at BC-3+CM-1 application. It was observed that the application of BC with either COM or AM increased SDW as compared to sole application, and the maximum 114% SDW increase was recorded with the combined application of BC-3+CM-1. Similarly, the highest 83% LA increase was recorded under BC-3+CM-1 as compared to Ck.
TABLE 3
| Treatments | RWC % | EL (%) | Photo. R (mmol m−2 S−1) | CC (mg g−1) | SC (mmol m2S−1) | WUE (μmol m-2s−1) |
|---|---|---|---|---|---|---|
| T0 | 49 ± 0.70d | 60.83 ± 7.08a | 10 ± 1.5f | 22.35 ± 4.71c | 146 ± 6.03e | 2.33 ± 0.29d |
| T1 | 59 ± 8.53bcd | 39.21 ± 1.21b | 13 ± 1.0cdef | 30.35 ± 1.89bc | 159 ± 15.39de | 3.17 ± 0.74bcd |
| T2 | 65 ± 1.21abc | 36.39 ± 1.62bc | 14 ± 1.2bcde | 34.15 ± 7.27bc | 178 ± 6.43cde | 3.77 ± 0.87bcd |
| T3 | 66 ± 3.99abc | 31.51 ± 2.18bc | 17 ± 1.8abc | 36.11 ± 2.03b | 194 ± 10.21cd | 4.83 ± 1.26abc |
| T4 | 70 ± 1.75ab | 30.54 ± 2.14bc | 19 ± 1.9ab | 43.44 ± 3.26ab | 238 ± 16.62ab | 6.70 ± 0.36a |
| T5 | 76 ± 1.70a | 19.30 ± 3.52d | 22 ± 1.0a | 51.19 ± 6.10a | 253 ± 7.55a | 6.83 ± 0.29a |
| T6 | 57 ± 4.32cd | 40.80 ± 2.70b | 10 ± 1.2ef | 33.80 ± 3.39bc | 158 ± 20.60de | 2.83 ± 0.29cd |
| T7 | 60 ± 6.86bcd | 36.79 ± 5.97bc | 12 ± 1.2def | 35.80 ± 1.57b | 168 ± 14.1cde | 3.77 ± 0.21bcd |
| T8 | 67 ± 2.05abc | 34.42 ± 4.90bc | 16 ± 2.0bcd | 40.09 ± 3.05ab | 199 ± 18.58bc | 5.13 ± 0.91ab |
| T9 | 68 ± 4.56abc | 26.85 ± 1.23cd | 19 ± 2.5ab | 41.73 ± 7.37ab | 240 ± 12.66a | 6.40 ± 0.87a |
Effect of CM, BC, and AM on physiological parameters of maize.
RWC, relative water contents; EL, electrolyte leakage; Photo. R, photosynthetic rate; CC, chlorophyll contents; SC, stomatal conductance; WUE, water use efficiency. Data is an average of three replicates ± SD and similar letter(s) in a column shows non-significant results at (p = 0.05). Note: T0 = Ck T1 = CM-0.5, T2 = CM-1, T3 = BC-3, T4 = BC-3+CM-0.5, T5 = BC-3+CM-1, T6 = AM-0.5, T7 = AM-1, T8 = BC-3+AM-0.5, and T9 = BC-3+AM-1.
Data regarding CL and 1000 GW showed maximum 71% increase in CL and 74% improvement in GW was recorded with the application of BC-3+CM-1 as compared to control.
Effect of CM, BC, and AM on the Physiological Parameters of Maize
Data regarding physiological parameters of maize showed BC-3+CM-1 application increased maximum 129% CC, 54% RWC, 128% PR, and 73% SC as compared to Ck (Table 4).
TABLE 4
| Treatments | Straw N | Straw P | Straw K | Grain N | Grain P | Grain K |
|---|---|---|---|---|---|---|
| T0 | 0.21 ± 0.01e | 0.59 ± 0.01e | 2.35 ± 0.05f | 0.45 ± 0.02f | 1.11 ± 0.03f | 3.7 ± 0.01f |
| T1 | 0.25 ± 0.01e | 0.70 ± 0.01d | 2.55 ± 0.05e | 0.57 ± 0.02e | 1.32 ± 0.03e | 5.0 ± 0.05e |
| T2 | 0.32 ± 0.04d | 0.78 ± 0.01c | 3.01 ± 0.02c | 0.63 ± 0.01d | 1.39 ± 0.03d | 5.6 ± 0.04d |
| T3 | 0.34 ± 0.01d | 0.90 ± 0.02b | 3.43 ± 0.05a | 0.85 ± 0.01c | 2.04 ± 0.02c | 6.6 ± 0.02c |
| T4 | 0.44 ± 0.02c | 0.99 ± 0.01a | 3.44 ± 0.05a | 0.90 ± 0.02b | 2.16 ± 0.03b | 6.8 ± 0.04b |
| T5 | 0.50 ± 0.01ab | 1.02 ± 0.07a | 3.52 ± 0.03a | 0.92 ± 0.02b | 2.21 ± 0.02ab | 7.1 ± 0.11a |
| T6 | 0.25 ± 0.01e | 0.65 ± 0.01de | 2.76 ± 0.03d | 0.61 ± 0.02de | 1.30 ± 0.02e | 5.0 ± 0.05e |
| T7 | 0.31 ± 0.02d | 0.79 ± 0.02c | 2.97 ± 0.03c | 0.63 ± 0.03d | 1.41 ± 0.02d | 5.7 ± 0.07d |
| T8 | 0.45 ± 0.02ab | 0.99 ± 0.01a | 3.23 ± 0.14b | 0.95 ± 0.02ab | 2.19 ± 0.02ab | 6.8 ± 0.05b |
| T9 | 0.52 ± 0.02a | 1.01 ± 0.03a | 3.52 ± 0.06a | 0.99 ± 0.01a | 2.23 ± 0.03a | 7.1 ± 0.11a |
Effect of CM, BC, and AM on nutritional status of maize.
N, nitrogen; P, phosphorus; K, potassium. Data is an average of three replicates ± SD and similar letter(s) in a column showed non-significant results at (p = 0.05). Note: T0 = Ck T1 = CM-0.5, T2 = CM-1, T3 = BC-3, T4 = BC-3+CM-0.5, T5 = BC-3+CM-1, T6 = AM-0.5, T7 = AM-1, T8 = BC-3+AM-0.5, and T9 = BC-3+AM-1.
Data regarding electrolyte leakage (EL) (Table 4) indicated that the application of BC significantly decreased EL at all COM and AM levels. Applying BC-3+CM-1 decreased electrolyte leakage by 215%, compared to the Ck.
Effect of CM, BC, and AM on Maize Nutrient Contents
It was noticed that BC, CM, and AM alone or in combination significantly increased nutrient contents in maize shoot and grain (Table 5). The maximum increase in straw N content was 72% with BC-3+CM-1 application. Similarly, maximum 55% increase in grain N was observed over control with BC-3+AM-1. The maximum 83% increase in straw P contents was noted with the sole BC-3 application, while 50% increase in grain P was observed with BC-3+CM-1 and BC-3+AM-1. The maximum 29% increase in straw K and 48% in grain K was observed with BC-3+CM-1 as compared to control.
TABLE 5
| FW | DW | L | CC | EL | LA | RWC | Ph | EC | CEC | CL | GW | PR | WUE | SC | SOC | CPI | LI | |
|---|---|---|---|---|---|---|---|---|---|---|---|---|---|---|---|---|---|---|
| FW | 1.000 | |||||||||||||||||
| DW | 0.972 | 1.000 | ||||||||||||||||
| L | 0.898 | 0.908 | 1.000 | |||||||||||||||
| CC | 0.939 | 0.882 | 0.866 | 1.000 | ||||||||||||||
| EL | −0.922 | −0.833 | −0.835 | −0.930 | 1.000 | |||||||||||||
| LA | 0.595 | 0.603 | 0.823 | 0.627 | −0.642 | 1.000 | ||||||||||||
| RWC | 0.913 | 0.932 | 0.988 | 0.848 | −0.816 | 0.810 | 1.000 | |||||||||||
| Ph | −0.589 | −0.519 | −0.377 | −0.590 | 0.696 | −0.105 | −0.370 | 1.000 | ||||||||||
| EC | 0.008 | 0.044 | −0.090 | −0.111 | 0.147 | −0.267 | −0.013 | −0.140 | 1.000 | |||||||||
| CEC | 0.951 | 0.959 | 0.858 | 0.887 | −0.800 | 0.536 | 0.876 | −0.402 | −0.104 | 1.000 | ||||||||
| CL | 0.840 | 0.849 | 0.982 | 0.801 | −0.798 | 0.886 | 0.973 | −0.291 | −0.131 | 0.801 | 1.000 | |||||||
| GW | 0.948 | 0.921 | 0.749 | 0.887 | −0.872 | 0.444 | 0.771 | −0.624 | 0.005 | 0.920 | 0.687 | 1.000 | ||||||
| PR | 0.977 | 0.984 | 0.940 | 0.890 | −0.872 | 0.644 | 0.949 | −0.496 | −0.064 | 0.958 | 0.890 | 0.899 | 1.000 | |||||
| WUE | 0.971 | 0.956 | 0.868 | 0.914 | −0.847 | 0.552 | 0.887 | −0.462 | −0.073 | 0.991 | 0.818 | 0.931 | 0.959 | 1.000 | ||||
| SC | 0.971 | 0.954 | 0.875 | 0.914 | −0.836 | 0.544 | 0.896 | −0.447 | −0.030 | 0.983 | 0.811 | 0.904 | 0.959 | 0.989 | 1.000 | |||
| SOC | 0.760 | 0.768 | 0.691 | 0.644 | −0.705 | 0.617 | 0.724 | −0.290 | −0.002 | 0.741 | 0.728 | 0.821 | 0.757 | 0.747 | 0.684 | 1.000 | ||
| CPI | 0.761 | 0.768 | 0.692 | 0.646 | −0.707 | 0.618 | 0.725 | −0.294 | −0.003 | 0.741 | 0.729 | 0.822 | 0.757 | 0.748 | 0.685 | 1.000 | 1.000 | |
| LI | −0.944 | −0.922 | −0.821 | −0.885 | 0.923 | −0.603 | −0.831 | 0.636 | 0.165 | −0.899 | −0.786 | −0.960 | −0.926 | −0.913 | −0.877 | −0.838 | −0.839 | 1.000 |
| CMI | 0.435 | 0.426 | 0.411 | 0.334 | −0.447 | 0.515 | 0.445 | −0.070 | 0.094 | 0.389 | 0.506 | 0.523 | 0.415 | 0.413 | 0.333 | 0.895 | 0.895 | −0.540 |
Correlations (Pearson) between plant and soil Parameters.
The abbreviations are as FW, fresh weight; DW, dry weight; L, shoot length; CC, chlorophyll contents; EL, electrolyte leakage; LA, leaf area; RWC, relative water content; Ph, soil Ph; EC, electrical conductivity; CEC, cation exchange capacity; CL, cob length; GW, grain weight; PR, photosynthetic rate; WUE, water use efficiency; SC, stomatal conductance; SOC, soil organic carbon; CPI, carbon pool index; LI, lability index; and CMI, carbon management index.
Correlations (Pearson) and Principal Component Analysis (PCA) Among Plant and Soil Parameters
Correlations between different plant and soil attributes was done and based on correlation analysis, it was observed that FW, SL had a positive correlation with CC, LA, RWC, PR, and WUE and whereas, significant negative correlation with EL and carbon liability index (LI).
Principal component analysis (PCA) was performed on different maize growth, physiological and soil parameters (Figures 3A–C). The PCA of maize growth and physiological parameters reveals that the first two principal components (PC1 and PC2) accounted for 88% of the overall variance of the treatments, with PC1 accounting for 87% of the variation. However, in this study, almost all characters in the first eigenvector had comparable effects on the total variance of the treatments, suggesting that the first component is virtually a measure of the whole characters. Further research revealed that the combined application of biochar with compost and animal manure (BC-3, BC-3+CM-0.5, BC-3+CM-1, BC-3+AM-0.5, and BC-3+AM-1) used were primarily concentrated in the positive end of PC 1 (Figure 3A). Simultaneously, the research indicated that the maize growth and physiological indices focused on the positive side of PC1 (Figure 3B).
The PCA plot (Figure 3C) revealed that two principal components accounted for 76.9% of the observed variability in the data set under examination (62.9% in PC1 and 14.6% in PC2). Treatments demonstrated a significant impact on soil variables: pH, EC, CEC, SOC, CPI, LI, and CMI. Similarly, soil parameters such as soil pH, electrical conductivity, and Lability Index were concentrated in the positive end of PC 2, and cation exchange capacity, soil organic carbon, Carbon pool index, and carbon management index were concentrated in the positive end of PC 1 (Figure 3C). The PCA findings confirmed that biochar and biochar co-composts had varying degrees of benefit in improving the deteriorated soil in this study.
Discussion
The physical and chemical properties of soil are critical in determining its crop productivity. Post-harvest soil properties indicated that the addition of BC, COM, and AM influenced soil pH, CEC, and TOC. This study showed a non-significant change in soil pH when compared between treatments (Figure 1) and a significant decrease was observed where AM-1 was applied. Similar results were observed by Song et al. (2018), where a low biochar addition did not significantly influence the pH of the alkaline soil. Rehman et al. (2021) observed decrease in soil pH because of AM and BC application, while increase in soil pH was observed with rice straw and cotton stick BC. Changes in soil pH in the rhizosphere modified the soil’s chemical environment and boosted the nutrient supply to plants (Hinsinger, 2001). The decrease in soil pH may have been due to the presence of humic substances that were released because of organic carbon decomposition (Singh et al., 2012) or ammonium nitrification due to the applied amendments (Antolín et al., 2005). It is well documented that pyrolysis temperature significantly affects the pH and nutrient content of BC (Kaudal et al., 2015; Rehrah et al., 2016). Generally, BC is alkaline in nature and its alkalinity rises with temperature (Shakya and Agarwal, 2020). Biochar prepared at low temperatures contains more acidic functional groups such as carboxyl (-COOH), hydroxyl (-OH), and methyl (-CH3) and these functional groups decrease as temperature increases and enhance the inorganic and basic oxide content, which increases the pH of biochar (Shaheen et al., 2019). Various studies have shown the pH of BC is between 5.9 and 12.3 (Ahmad et al., 2014; Kaudal et al., 2015; Rehrah et al., 2016). In recent years, several studies have been carried out to check the effect of BC on alkaline and sandy soils (Blackwell et al., 2010; Song et al., 2014; Abbas et al., 2020).
Many researchers have found that BC and other OAs could enhance soil quality and plant performance in degraded soil (Kammann, et al., 2016; Głąb et al., 2018; Abbas et al., 2020). Our results showed that BC, COM, and AM significantly increased SOM in soil (Figure 3B), which may have been due to the high carbon content of BC. The current study results showed BC, COM, and significantly increased MBC in soil (Figure 3A), which may have been due to the high carbon content of BC. The aromatic structure of BC provides resistance to decomposition, which increases SOM in soil (Wang et al., 2016). Several authors have observed that OAs increase SOC in soil (Wang et al., 2016; Schiedung et al., 2019; Wu et al., 2021). This may have been due to increased water and nutrient availability to soil microbes. The porous structure of BC provides shelter to the microbes against abiotic and biotic stresses. Various other properties, such as high porosity, large surface area, pore size and distribution play a key role in nutrient availability and retention, which can influence microbial activity (Zhao et al., 2022). Fleming et al. (2013) observed that chicken manure contains several nutrients that can increase soil nutrient content, enhance soil aggregate structure and stability, and increase soil microbial activity in degraded soil. Trupiano et al. (2017) observed that the sole or combined application of biochar and compost increased total organic carbon, more so than in the non-amended soils, which indicated that BC and/or compost applications to soils could improve C build-up and sequestration. Moreover, recent studies indicated that the use of OAs in soil improved organic carbon, which, in turn, improved nutrient availability (Hille and den Ouden, 2005). Brtnicky et al. (2019) observed an increase in MBC because of BC application to soil. This increase may have been due to the availability of nutrients and labile organic compounds. The labile part of SOCs plays a key role in maintaining soil fertility, while the recalcitrant fraction of SOM has a constructive influence on environmental quality (Brtnicky et al., 2019).
This study showed that the application of BC, COM, and AM positively affected maize growth and yield (Table 3) in less fertile soil. Biochar has a porous structure, a large surface area, and a high surface charge density, which are all beneficial for absorbing soil moisture, enhancing soil porosity, lowering bulk density, and producing an environment conducive to plant development (Hui, 2021). Biochar itself is a rich source of important macronutrients (particularly N, P, and K), and certain metal ions (e.g., Ca+2 and Mg+2) that supply nutrients for plant development, their addition and complex interaction with soil releases plant nutrients from the exchange site in a soil solution, it also retains plant nutrients due to large surface area and greater C:N ratio (Biederman and Harpole, 2013; Lehmann et al., 2015). Previous studies showed that the addition of BC in soil increased biomass in lettuce and Arabidopsis (Viger et al., 2015), maize (Uzoma et al., 2011) and wheat (Solaiman et al., 2010). Al-Omran et al. (2019) observed that compost application in soil improved soil aeration, water retention capacity, reduced bulk density and improved soil structure, which ultimately increased plant growth. Similarly, Rawat et al. (2019) noted that the combined application of BC and compost enhanced fertiliser-use efficiency (FUE) through the controlled release of nutrients and reduced nutrient leaching (Rawat et al., 2019).
Biochar and other AOs (AM and COM) and had positive effects on crop growth and yield because they retain nutrients via adsorption, binding, and co-precipitation (Lashari et al., 2015; Luo et al., 2017; Al-Omran et al., 2019; Rahman et al., 2020). Similarly, the combined use of compost and BC had positive effects on crop growth and yield (Lashari et al., 2015; Luo et al., 2017; Al-Omran et al., 2019; Rahman et al., 2020). In this study, the significant increases in maize growth may have been due to an improvement in soil structure, soil aeration, an increase in CEC, improved nutrient regulation and an overall improvement in soil physiochemical properties. These changes in soil supplied additional nutrients, improved water retention capacity, and reduced nutrient leaching, resulting in improved plant growth, yields and sustainable soil productivity (Agegnehu et al., 2015; Noor et al., 2017; Cao et al., 2018; Radin et al., 2018).
The data presented (Table 4) indicate that the sole or combined application of BC, CM, and AM significantly (p < 0.05) increased chlorophyll content, WUE, RWC and EL, compared to the control. Another experiment showed that the combined application of wheat straw BC, biogas slurry and compost decreased RWC and EL by 23% and 39%, respectively, while increasing TR, CC, SC, and WUE by 77%, 90%, 49%, and 97%, respectively, compared to the control (Rahman et al., 2020). Agegnehu et al. (2015) observed a significant improvement in chlorophyll content because of BC-compost with chemical fertilizer application in soil. Water use efficiency is an important indicator of crop productivity and water use in arid and semiarid areas (Batool et al., 2015). Biochar addition has been shown to improve water retention in soil, resulting in soil structure improvement by reducing bulk density and protecting crops against drought (Abel et al., 2013; Sun and Lu, 2014). Solaiman et al. (2010) observed an increase in stomatal conductance because of BC addition to soil. Similarly, a 3%–7% increase in moisture content, which resulted in an increased rate of photosynthesis because of BC (2%) in soil, was observed by Ippolito et al. (2012).
Carbon is the main component of biochar that contains oxygen (O2), hydrogen (H), N, K, P, Mg, and other micronutrients that, when directly available for plant uptake, can improve crop yield in most crops (Seleiman et al., 2020). Biochar’s large surface area and porous structure help to retain applied nutrients and reduce nutrient leaching of N and P, releasing them when needed (Abbas et al., 2020). The application of BC and compost increased the P contents in maize straw due to lower adsorption on the exchange site and increased root growth. Recent studies indicated that BC amended increased the K contents, resulting in higher plant growth (Steiner et al., 2007). Overall, this study indicated that the use of biochar with other OAs not only increased the FUE through the slow release of nutrients but also acted as a soil conditioner that improved soil properties. The application of biochar with other amendments can thus provide a sustainable approach that will support the restoration of soil fertility and crop productivity and, hence, contribute to a circular economy.
The PCA results related to maize growth and physiological parameters reveal that the PC1 and PC2 accounted for 88% of the overall variance of the treatments, with PC1 accounting for 87% of the variation (Figure 3B). Agegnehu et al. (2015) perform correlation and PCA analysis on different growth parameter under biochar and compost application and observed plant height, root biomass, chlorophyll content, and specific leaf weight were positively significantly correlated with maize shoot biomass (r = 0.96, 0.98, 0.99, and 0.92, respectively). The PCA found that the first two principal components (PC1 and PC2) accounted for 91% of the overall variance of the treatments, with PC1 accounting for 84% of the variation. Similarly, Tsai and Chang, (2020) used different biochar rates (0%), 0.5%, 1.0%, and 2.0% (w/w) along with 5% (w/w) poultry-livestock manure compost. PCA was used to study the essential components in the big data set, and several factors such as NO3-N, TIN, soil pH, EC, DOC, TC, TN, C:N ratio, P and K were added as analysis variables in the PCA at the beginning (day 3) and end (day 371) of the incubation study. The PCA results revealed that the PC1 and PC2 explained 34.5% and 21.3% of the total variance in slightly acidic Oxisols (SAO), 30.2% and 23.4% of the total variance in mildly alkaline Inceptisols (MAI), and 38.2% and 22.6% of the total variance in slightly acid Inceptisols (SAI) soils at day 3, accounting for 55.8%, 53.6%, and 60.8% of the total variance, respectively. At day 371, PC1 and PC2 explained and accounted for 68.5%, 66.9%, and 61.9% of the total change in SAO, MAI, and SAI soils, respectively. Ye et al. (2023) applied PCA analysis on soil and tea indexes measured after the application of various dosages of sheep manure from 2018 to 2022, with PC1 contributing the most, ranging from 84.7% to 97.6%. Further investigation found that the low dose (6 t/hm2–12 t/hm2) were generally concentrated in the negative end of PC1, however the high dosage (15 t/hm2-18 t/hm2) was more concentrated in the positive end of PC1.
Conclusion
This study highlighted the potential of organic amendments, especially BC, CM, and AM, as a sustainable option for increasing agricultural yields, improving soil qualities, and contributing to a circular economy. Combining 3% BC with 1% COM, and 1% AM proved to be a successful strategy, with significant improvements in plant height, shoot weight, and grain weight, carbon pool index, and microbial biomass carbon. These findings not only indicate high yield, but also highlight the ability of organic additions to restore even the most nutrient-depleted soils. These OAs provide a ray of hope for sustainable agriculture by tackling the issues of soil degradation caused by intensive farming and climate change. By accepting these organic solutions, we begin a path toward a robust and resilient food system that will protect our future. Additional studies and field experiments are needed to confirm these findings and investigate the long-term impacts of organic additions on soil health and at variable rates and with site and/or crop-specific fertiliser doses under field conditions.
Statements
Data availability statement
The original contributions presented in the study are included in the article/Supplementary material, further inquiries can be directed to the corresponding authors.
Author contributions
Conceptualization, AM, MN, and MS; methodology, AA and KS; software, AA and LA; validation, MA, AM, and MN; formal analysis, AA and LA; investigation, MN, AA, and NA; resources, AM and MS; data curation, AA, KS, and NA; writing–original draft preparation, AA and AM; writing–review and editing, MN, MS, AM, and MA; funding acquisition, MS, AM, and MN. All authors contributed to the article and approved the submitted version.
Funding
The author(s) declare financial support was received for the research, authorship, and/or publication of this article. The authors would like to extend their sincere appreciation to the Researchers Supporting Project number (RSP2024R347), King Saud University, Riyadh, Saudi Arabia.
Acknowledgments
The authors extend their appreciation to the staff of Environmental Science Lab, UAF, Pakistan. The authors would like to extend their sincere appreciation to the Researchers Supporting Project number (RSP2024R347), King Saud University, Riyadh, Saudi Arabia.
Conflict of interest
The authors declare that the research was conducted in the absence of any commercial or financial relationships that could be construed as a potential conflict of interest.
References
1
Abbas A. Naveed M. Azeem M. Yaseen M. Ullah R. Alamri S. et al (2020). Efficiency of Wheat Straw Biochar in Combination With Compost and Biogas Slurry for Enhancing Nutritional Status and Productivity of Soil and Plant. Plants9 (11), 1516. 10.3390/plants9111516
2
Abel S. Peters A. Trinks S. Schonsky H. Facklam M. Wessolek G. (2013). Impact of Biochar and Hydrochar Addition on Water Retention and Water Repellency of Sandy Soil. Geoderma202–203, 183–191. 10.1016/j.geoderma.2013.03.003
3
Abrar M. M. Xu M. Shah S. A. A. Aslam M. W. Aziz T. Mustafa A. et al (2020). Variations in the Profile Distribution and Protection Mechanisms of Organic Carbon Under Long-Term Fertilization in a Chinese Mollisol. Sci. Total Environ.723, 138181. 10.1016/j.scitotenv.2020.138181
4
Adnan M. Fahad S. Zamin M. Shah S. Mian I. A. Danish S. et al (2020). Coupling Phosphate-Solubilizing Bacteria With Phosphorus Supplements Improve Maize Phosphorus Acquisition and Growth Under Lime Induced Salinity Stress. Plants9 (7), 900. 10.3390/plants9070900
5
Agegnehu G. Bass A. M. Nelson P. N. Muirhead B. Wright G. Bird M. I. (2015). Biochar and Biochar-Compost as Soil Amendments: Effects on Peanut Yield, Soil Properties and Greenhouse Gas Emissions in Tropical North Queensland, Australia. Agric. Ecosyst. Environ.213, 72–85. 10.1016/j.agee.2015.07.027
6
Ahmad M. Rajapaksha A. U. Lim J. E. Zhang M. Bolan N. Mohan D. et al (2014). Biochar as a Sorbent for Contaminant Management in Soil and Water: A Review. Chemosphere99, 19–33. 10.1016/j.chemosphere.2013.10.071
7
Al-Omran A. Ibrahim A. Alharbi A. (2019). Evaluating the Impact of Combined Application of Biochar and Compost on Hydro-Physical Properties of Loamy Sand Soil. Commun. Soil Sci. Plant Analysis50 (19), 2442–2456. 10.1080/00103624.2019.1667371
8
Amoakwah E. Arthur E. Frimpong K. A. Parikh S. J. Islam R. (2020). Soil Organic Carbon Storage and Quality Are Impacted by Corn Cob Biochar Application on a Tropical Sandy Loam. J. Soils Sediments20 (4), 1960–1969. 10.1007/s11368-019-02547-5
9
Anderson I. (1993). Tropical Soil Biology and Fertility: A Handbook of Methods. CAB International. 10.1097/00010694-199404000-00012
10
Antolín M. C. Pascual I. García C. Polo A. Sánchez-Díaz M. (2005). Growth, Yield and Solute Content of Barley in Soils Treated With Sewage Sludge Under Semiarid Mediterranean Conditions. Field Crops Res.94 (2–3), 224–237. 10.1016/j.fcr.2005.01.009
11
Arya S. Williams A. Reina S. V. Knapp C. W. Kreft J. U. Hobman J. L. et al (2021). Towards a General Model for Predicting Minimal Metal Concentrations Co-Selecting for Antibiotic Resistance Plasmids. Environ. Pollut.275, 116602. 10.1016/j.envpol.2021.116602
12
Azeem M. Sun D. Crowley D. Hayat R. Hussain Q. Ali A. et al (2020). Crop Types Have Stronger Effects on Soil Microbial Communities and Functionalities Than Biochar or Fertilizer During Two Cycles of Legume-Cereal Rotations of Dry Land. Sci. Total Environ.715, 136958. 10.1016/j.scitotenv.2020.136958
13
Aziz H. Wang X. Murtaza G. Ashar A. Hussain S. Abid M. et al (2021). Evaluation of Compost and Biochar to Mitigate Chlorpyrifos Pollution in Soil and Their Effect on Soil Enzyme Dynamics. Sustainability13 (17), 9695. 10.3390/su13179695
14
Batool A. Taj S. Rashid A. Khalid A. Qadeer S. Saleem A. R. et al (2015). Potential of Soil Amendments (Biochar and Gypsum) in Increasing Water Use Efficiency of Abelmoschus Esculentus L. Moench. Front. Plant Sci.6, 733. 10.3389/fpls.2015.00733
15
Ben-Asher J. Tsuyuki I. Bravdo B.-A. Sagih M. (2006). Irrigation of Grapevines With Saline Water. Agric. Water Manag.83 (1–2), 13–21. 10.1016/j.agwat.2006.01.002
16
Biederman L. A. Harpole W. S. (2013). Biochar and Its Effects on Plant Productivity and Nutrient Cycling: A Meta-Analysis. GCB Bioenergy5 (2), 202–214. 10.1111/gcbb.12037
17
Blackwell P. Krull E. Butler G. Herbert A. Solaiman Z. (2010). Effect of Banded Biochar on Dryland Wheat Production and Fertiliser Use in South-Western Australia: An Agronomic and Economic Perspective. Soil Res.48 (7), 531. 10.1071/SR10014
18
Blair G. Lefroy R. Lisle L. (1995). Soil Carbon Fractions Based on Their Degree of Oxidation, and the Development of a Carbon Management Index for Agricultural Systems. Aust. J. Agric. Res.46 (7), 1459. 10.1071/AR9951459
19
Bouyoucos G. J. (1962). Hydrometer Method Improved for Making Particle Size Analyses of Soils 1. Agron. J.54 (5), 464–465. 10.2134/agronj1962.00021962005400050028x
20
Bremner J. M. (2016). Total Nitrogen, 1149–1178. 10.2134/agronmonogr9.2.c32
21
Brookes P. C. Landman A. Pruden G. Jenkinson D. S. (1985). Chloroform Fumigation and the Release of Soil Nitrogen: A Rapid Direct Extraction Method to Measure Microbial Biomass Nitrogen in Soil. Soil Biol. Biochem.17 (6), 837–842. 10.1016/0038-0717(85)90144-0
22
Brtnicky M. Dokulilova T. Holatko J. Pecina V. Kintl A. Latal O. et al (2019). Long-Term Effects of Biochar-Based Organic Amendments on Soil Microbial Parameters. Agronomy9 (11), 747. 10.3390/agronomy9110747
23
Cao L. Yu I. K. M. Tsang D. C. W. Zhang S. Ok Y. S. Kwon E. E. et al (2018). Phosphoric Acid-Activated Wood Biochar for Catalytic Conversion of Starch-Rich Food Waste Into Glucose and 5-Hydroxymethylfurfural. Bioresour. Technol.267, 242–248. 10.1016/j.biortech.2018.07.048
24
Estefan G. Sommer R. Ryan J. (2013). Methods of Soil, Plant, and Water Analysis. A Man. West Asia North Afr. region3 (2).
25
Fleming M. Tai Y. Zhuang P. McBride M. B. (2013). Extractability and Bioavailability of Pb and as in Historically Contaminated Orchard Soil: Effects of Compost Amendments. Environ. Pollut.177, 90–97. 10.1016/j.envpol.2013.02.013
26
Gaskin J. W. Speir R. A. Harris K. Das K. C. Lee R. D. Morris L. A. et al (2010). Effect of Peanut Hull and Pine Chip Biochar on Soil Nutrients, Corn Nutrient Status, and Yield. Agron. J.102 (2), 623–633. 10.2134/agronj2009.0083
27
Głąb T. Żabiński A. Sadowska U. Gondek K. Kopeć M. Mierzwa–Hersztek M. et al (2018). Effects of Co-Composted Maize, Sewage Sludge, and Biochar Mixtures on Hydrological and Physical Qualities of Sandy Soil. Geoderma315, 27–35. 10.1016/j.geoderma.2017.11.034
28
Gregory A. S. Ritz K. McGrath S. P. Quinton J. N. Goulding K. W. T. Jones R. J. A. et al (2015). A Review of the Impacts of Degradation Threats on Soil Properties in the UK. Soil Use Manag.31, 1–15. 10.1111/sum.12212
29
Haider F. U. Liqun C. Coulter J. A. Cheema S. A. Wu J. Zhang R. et al (2021). Cadmium Toxicity in Plants: Impacts and Remediation Strategies. Ecotoxicol. Environ. Saf.211, 111887. 10.1016/j.ecoenv.2020.111887
30
Hille M. den Ouden J. (2005). Charcoal and Activated Carbon as Adsorbate of Phytotoxic Compounds - A Comparative Study. Oikos108 (1), 202–207. 10.1111/j.0030-1299.2005.13482.x
31
Hinsinger P. (2001). Bioavailability of Soil Inorganic P in the Rhizosphere as Affected by Root-Induced Chemical Changes: A Review. Plant Soil237 (2), 173–195. 10.1023/A:1013351617532
32
Hui D. (2021). Effects of Biochar Application on Soil Properties, Plant Biomass Production, and Soil Greenhouse Gas Emissions: A Mini-Review. Agric. Sci.12 (03), 213–236. 10.4236/as.2021.123014
33
Ippolito J. A. Novak J. M. Busscher W. J. Ahmedna M. Rehrah D. Watts D. W. (2012). Switchgrass Biochar Affects Two Aridisols. J. Environ. Qual.41 (4), 1123–1130. 10.2134/jeq2011.0100
34
Kamara A. Sorie Kamara H. Saimah Kamara M. (2015). Effect of Rice Straw Biochar on Soil Quality and the Early Growth and Biomass Yield of Two Rice Varieties. Agric. Sci.06 (08), 798–806. 10.4236/as.2015.68077
35
Kammann C. Glaser B. Schmidt H. P. (2016). “Combining Biochar and Organic Amendments,” in Biochar in European Soils and Agriculture (Routledge), 158–186.
36
Kaudal B. B. Chen D. Madhavan D. B. Downie A. Weatherley A. (2015). Pyrolysis of Urban Waste Streams: Their Potential Use as Horticultural Media. J. Anal. Appl. Pyrolysis112, 105–112. 10.1016/j.jaap.2015.02.011
37
Kocsis T. Ringer M. Biró B. (2022). Characteristics and Applications of Biochar in Soil–Plant Systems: A Short Review of Benefits and Potential Drawbacks. Appl. Sci.12 (8), 4051. 10.3390/app12084051
38
Lal R. (2015). Restoring Soil Quality to Mitigate Soil Degradation. Sustainability7 (5), 5875–5895. 10.3390/su7055875
39
Lashari M. S. Ye Y. Ji H. Li L. Kibue G. W. Lu H. et al (2015). Biochar-Manure Compost in Conjunction With Pyroligneous Solution Alleviated Salt Stress and Improved Leaf Bioactivity of Maize in a Saline Soil From Central China: A 2-Year Field Experiment. J. Sci. Food Agric.95 (6), 1321–1327. 10.1002/jsfa.6825
40
Lehmann J. Kuzyakov Y. Pan G. Ok Y. S. (2015). Biochars and the Plant-Soil Interface. Plant Soil395 (1–2), 1–5. 10.1007/s11104-015-2658-3
41
Lillenberg M. Yurchenko S. Kipper K. Herodes K. Pihl V. Lõhmus R. et al (2010). Presence of Fluoroquinolones and Sulfonamides in Urban Sewage Sludge and Their Degradation as a Result of Composting. Int. J. Environ. Sci. Technol.7 (2), 307–312. 10.1007/BF03326140
42
Luo X. Liu G. Xia Y. Chen L. Jiang Z. Zheng H. et al (2017). Use of Biochar-Compost to Improve Properties and Productivity of the Degraded Coastal Soil in the Yellow River Delta, China. J. Soils Sediments17 (3), 780–789. 10.1007/s11368-016-1361-1
43
Mayak S. Tirosh T. Glick B. R. (2004). Plant Growth-Promoting Bacteria Confer Resistance in Tomato Plants to Salt Stress. Plant Physiology Biochem.42 (6), 565–572. 10.1016/j.plaphy.2004.05.009
44
Naeem M. A. Khalid M. Aon M. Abbas G. Amjad M. Murtaza B. et al (2018). Combined Application of Biochar With Compost and Fertilizer Improves Soil Properties and Grain Yield of Maize. J. Plant Nutr.41 (1), 112–122. 10.1080/01904167.2017.1381734
45
Naveed M. Sajid H. Mustafa A. Niamat B. Ahmad Z. Yaseen M. et al (2020). Alleviation of Salinity-Induced Oxidative Stress, Improvement in Growth, Physiology and Mineral Nutrition of Canola (Brassica Napus L.) Through Calcium-Fortified Composted Animal Manure. Sustainability12 (3), 846. 10.3390/su12030846
46
Naveed M. Tanvir B. Xiukang W. Brtnicky M. Ditta A. Kucerik J. et al (2021). Co-Composted Biochar Enhances Growth, Physiological, and Phytostabilization Efficiency of Brassica Napus and Reduces Associated Health Risks Under Chromium Stress. Front. Plant Sci.12, 775785. 10.3389/fpls.2021.775785
47
Nguyen B. T. Trinh N. N. Le C. M. T. Nguyen T. T. van Tran T. Thai B. V. et al (2018). The Interactive Effects of Biochar and Cow Manure on Rice Growth and Selected Properties of Salt-Affected Soil. Archives Agron. Soil Sci.64 (12), 1744–1758. 10.1080/03650340.2018.1455186
48
Niamat B. Naveed M. Ahmad Z. Yaseen M. Ditta A. Mustafa A. et al (2019). Calcium-Enriched Animal Manure Alleviates the Adverse Effects of Salt Stress on Growth, Physiology and Nutrients Homeostasis of Zea Mays L. Plants8 (11), 480. 10.3390/plants8110480
49
Noor N. M. Othman R. Mubarak N. M. Abdullah E. C. (2017). Agricultural Biomass-Derived Magnetic Adsorbents: Preparation and Application for Heavy Metals Removal. J. Taiwan Inst. Chem. Eng.78, 168–177. 10.1016/j.jtice.2017.05.023
50
Novotny E. H. Maia C. M. B. F. Carvalho M. T. M. Madari B. E. (2015). Biochar: Pyrogenic Carbon for Agricultural Use- A Critical Review. Rev. Bras. Ciência Do Solo39 (2), 321–344. 10.1590/01000683rbcs20140818
51
Obalum S. E. Chibuike G. U. Peth S. Ouyang Y. (2017). Soil Organic Matter as Sole Indicator of Soil Degradation. Environ. Monit. Assess.189 (4), 176. 10.1007/s10661-017-5881-y
52
Olsen R. Cole C. V. Watanabe F. S. Dean L. A. (1954). Estimation of Available Phosphorus in Soils by Extraction With NaHCO3. Washington, DC: U.S. Department of Agriculture, 939.
53
Pandit N. R. Schmidt H. P. Mulder J. Hale S. E. Husson O. Cornelissen G. (2020). Nutrient Effect of Various Composting Methods With and Without Biochar on Soil Fertility and Maize Growth. Archives Agron. Soil Sci.66 (2), 250–265. 10.1080/03650340.2019.1610168
54
Peng S. Zheng H. Herrero-Fresno A. Olsen J. E. Dalsgaard A. Ding Z. (2021). Co-Occurrence of Antimicrobial and Metal Resistance Genes in Pig Feces and Agricultural Fields Fertilized With Slurry. Sci. Total Environ.792, 148259. 10.1016/j.scitotenv.2021.148259
55
Radin R. Abu Bakar R. Ishak C. F. Ahmad S. H. Tsong L. C. (2018). Biochar-Compost Mixture as Amendment for Improvement of Polybag-Growing Media and Oil Palm Seedlings at Main Nursery Stage. Int. J. Recycl. Org. Waste Agric.7 (1), 11–23. 10.1007/s40093-017-0185-3
56
Rahman G. K. M. M. Rahman M. M. Alam M. S. Kamal M. Z. Mashuk H. A. Datta R. et al (2020). “Biochar and Organic Amendments for Sustainable Soil Carbon and Soil Health,” in Carbon and Nitrogen Cycling in Soil (Singapore: Springer), 45–85. 10.1007/978-981-13-7264-3_3
57
Rawat J. Saxena J. Sanwal P. (2019). “Biochar: A Sustainable Approach for Improving Plant Growth and Soil Properties,” in Biochar - an Imperative Amendment for Soil and the Environment (IntechOpen). 10.5772/intechopen.82151
58
Rehman I. Riaz M. Ali S. Arif M. S. Ali S. Alyemeni M. N. et al (2021). Evaluating the Effects of Biochar With Farmyard Manure Under Optimal Mineral Fertilizing on Tomato Growth, Soil Organic C and Biochemical Quality in a Low Fertility Soil. Sustainability13 (5), 2652. 10.3390/su13052652
59
Rehman M. Z. Rizwan M. Ali S. Fatima N. Yousaf B. Naeem A. et al (2016). Contrasting Effects of Biochar, Compost and Farm Manure on Alleviation of Nickel Toxicity in Maize (Zea Mays L.) in Relation to Plant Growth, Photosynthesis and Metal Uptake. Ecotoxicol. Environ. Saf.133, 218–225. 10.1016/j.ecoenv.2016.07.023
60
Rehrah D. Bansode R. R. Hassan O. Ahmedna M. (2016). Physico-Chemical Characterization of Biochars From Solid Municipal Waste for Use in Soil Amendment. J. Anal. Appl. Pyrolysis118, 42–53. 10.1016/j.jaap.2015.12.022
61
Rivelli A. R. Libutti A. (2022). Effect of Biochar and Inorganic or Organic Fertilizer Co-Application on Soil Properties, Plant Growth and Nutrient Content in Swiss Chard. Agronomy12 (9), 2089. 10.3390/agronomy12092089
62
Ross D. J. Täte K. R. (1993). Microbial C and N, and Respiratory Activity, in Litter and Soil of a Southern Beech (Nothofagus) Forest: Distribution and Properties. Soil Biol. Biochem.25 (4), 477–483. 10.1016/0038-0717(93)90073-K
63
Sairam R. K. Rao K. V. Srivastava G. C. (2002). Differential Response of Wheat Genotypes to Long Term Salinity Stress in Relation to Oxidative Stress, Antioxidant Activity and Osmolyte Concentration. Plant Sci.163 (5), 1037–1046. 10.1016/S0168-9452(02)00278-9
64
Sánchez M. E. Lindao E. Margaleff D. Martínez O. Morán A. (2009). Pyrolysis of Agricultural Residues From Rape and Sunflowers: Production and Characterization of Bio-Fuels and Biochar Soil Management. J. Anal. Appl. Pyrolysis85 (1–2), 142–144. 10.1016/j.jaap.2008.11.001
65
Sánchez-García M. Sánchez-Monedero M. A. Roig A. López-Cano I. Moreno B. Benitez E. et al (2016). Compost vs Biochar Amendment: A Two-Year Field Study Evaluating Soil C Build-Up and N Dynamics in an Organically Managed Olive Crop. Plant Soil408 (1–2), 1–14. 10.1007/s11104-016-2794-4
66
Schiedung M. Tregurtha C. S. Beare M. H. Thomas S. M. Don A. (2019). Deep Soil Flipping Increases Carbon Stocks of New Zealand Grasslands. Glob. Change Biol.25 (7), 2296–2309. 10.1111/gcb.14588
67
Schofield R. K. Taylor A. W. (1955). The Measurement of Soil pH. Soil Sci. Soc. Am. J.19 (2), 164–167. 10.2136/sssaj1955.03615995001900020013x
68
Seleiman M. F. Almutairi K. F. Alotaibi M. Shami A. Alhammad B. A. Battaglia M. L. (2020). Nano-Fertilization as an Emerging Fertilization Technique: Why Can Modern Agriculture Benefit From Its Use?Plants10 (1), 2. 10.3390/plants10010002
69
Shaheen S. M. Niazi N. K. Hassan N. E. E. Bibi I. Wang H. Tsang D. C. W. et al (2019). Wood-Based Biochar for the Removal of Potentially Toxic Elements in Water and Wastewater: A Critical Review. Int. Mater. Rev.64 (4), 216–247. 10.1080/09506608.2018.1473096
70
Shakoor A. Ashraf F. Shakoor S. Mustafa A. Rehman A. Altaf M. M. (2020). Biogeochemical Transformation of Greenhouse Gas Emissions From Terrestrial to Atmospheric Environment and Potential Feedback to Climate Forcing. Environ. Sci. Pollut. Res.27 (31), 38513–38536. 10.1007/s11356-020-10151-1
71
Shakya A. Agarwal T. (2020). “Potential of Biochar for the Remediation of Heavy Metal Contaminated Soil,” in Biochar Applications in Agriculture and Environment Management (Springer International Publishing), 77–98. 10.1007/978-3-030-40997-5_4
72
Singh R. Singh P. Singh H. Raghubanshi A. S. (2019). Impact of Sole and Combined Application of Biochar, Organic and Chemical Fertilizers on Wheat Crop Yield and Water Productivity in a Dry Tropical Agro-Ecosystem. Biochar1 (2), 229–235. 10.1007/s42773-019-00013-6
73
Singh R. P. Singh P. Ibrahim M. H. Hashim R. (2012). Land Application of Sewage Sludge: Physicochemical and Microbial Response. Rev. Environ. Contam. Toxicol.214, 41–61. 10.1007/978-1-4614-0668-6_3
74
Solaiman Z. M. Blackwell P. Abbott L. K. Storer P. (2010). Direct and Residual Effect of Biochar Application on Mycorrhizal Root Colonisation, Growth and Nutrition of Wheat. Soil Res.48 (7), 546. 10.1071/SR10002
75
Song D. Tang J. Xi X. Zhang S. Liang G. Zhou W. et al (2018). Responses of Soil Nutrients and Microbial Activities to Additions of Maize Straw Biochar and Chemical Fertilization in a Calcareous Soil. Eur. J. Soil Biol.84, 1–10. 10.1016/j.ejsobi.2017.11.003
76
Song Y. Zhang X. Ma B. Chang S. X. Gong J. (2014). Biochar Addition Affected the Dynamics of Ammonia Oxidizers and Nitrification in Microcosms of a Coastal Alkaline Soil. Biol. Fertil. Soils50 (2), 321–332. 10.1007/s00374-013-0857-8
77
Sparling G. P. West A. W. (1988). A Direct Extraction Method to Estimate Soil Microbial C: Calibration In Situ Using Microbial Respiration and 14C Labelled Cells. Soil Biol. Biochem.20 (3), 337–343. 10.1016/0038-0717(88)90014-4
78
Srivastava P. Singh R. Bhadouria R. Tripathi S. Raghubanshi A. S. (2020). Temporal Change in Soil Physicochemical, Microbial, Aggregate and Available C Characteristic in Dry Tropical Ecosystem. Catena190, 104553. 10.1016/j.catena.2020.104553
79
Steel R. G. D. Torrie J. H. Dickey D. A. (1997). Principles and Procedures of Statistics: A Biometrical Approach.
80
Steiner C. Teixeira W. G. Lehmann J. Nehls T. de Macêdo J. L. V. Blum W. E. H. et al (2007). Long Term Effects of Manure, Charcoal and Mineral Fertilization on Crop Production and Fertility on a Highly Weathered Central Amazonian Upland Soil. Plant Soil291 (1–2), 275–290. 10.1007/s11104-007-9193-9
81
Sun F. Lu S. (2014). Biochars Improve Aggregate Stability, Water Retention, and Pore-Space Properties of Clayey Soil. J. Plant Nutr. Soil Sci.177 (1), 26–33. 10.1002/jpln.201200639
82
Sutton N. B. Grotenhuis T. Rijnaarts H. H. M. (2014). Impact of Organic Carbon and Nutrients Mobilized During Chemical Oxidation on Subsequent Bioremediation of a Diesel-Contaminated Soil. Chemosphere97, 64–70. 10.1016/j.chemosphere.2013.11.005
83
Trupiano D. Cocozza C. Baronti S. Amendola C. Vaccari F. P. Lustrato G. et al (2017). The Effects of Biochar and Its Combination With Compost on Lettuce (Lactuca Sativa L.) Growth, Soil Properties, and Soil Microbial Activity and Abundance. Int. J. Agron.2017, 1–12. 10.1155/2017/3158207
84
Tsai C. C. Chang Y. F. (2020). Effects of Biochar to Excessive Compost-Fertilized Soils on the Nutrient Status. Agronomy10 (5), 683. 10.3390/agronomy10050683
85
Urra J. Alkorta I. Garbisu C. (2019). Potential Benefits and Risks for Soil Health Derived From the Use of Organic Amendments in Agriculture. Agronomy9 (9), 542. 10.3390/agronomy9090542
86
Uzoma K. C. Inoue M. Andry H. Fujimaki H. Zahoor A. Nishihara E. (2011). Effect of Cow Manure Biochar on Maize Productivity Under Sandy Soil Condition. Soil Use Manag.27 (2), 205–212. 10.1111/j.1475-2743.2011.00340.x
87
Viger M. Hancock R. D. Miglietta F. Taylor G. (2015). More Plant Growth But Less Plant Defence? First Global Gene Expression Data for Plants Grown in Soil Amended With Biochar. GCB Bioenergy7 (4), 658–672. 10.1111/gcbb.12182
88
Walkley A. (1947). A Critical Examination of a Rapid Method for Determining Organic Carbon in Soils – Effect of Variations in Digestion Conditions and of Inorganic Soil Constituents. Soil Sci.63 (4), 251–264. 10.1097/00010694-194704000-00001
89
Wang J. Xiong Z. Kuzyakov Y. (2016). Biochar Stability in Soil: Meta-Analysis of Decomposition and Priming Effects. GCB Bioenergy8 (3), 512–523. 10.1111/gcbb.12266
90
Wellburn A. R. (1994). The Spectral Determination of Chlorophylls a and B, as Well as Total Carotenoids, Using Various Solvents With Spectrophotometers of Different Resolution. J. Plant Physiology144 (3), 307–313. 10.1016/S0176-1617(11)81192-2
91
Wolf B. (1982). A Comprehensive System of Leaf Analyses and Its Use for Diagnosing Crop Nutrient Status. Commun. Soil Sci. Plant Analysis13 (12), 1035–1059. 10.1080/00103628209367332
92
Wu L. Zhang S. Ma R. Chen M. Wei W. Ding X. (2021). Carbon Sequestration Under Different Organic Amendments in Saline-Alkaline Soils. CATENA196, 104882. 10.1016/j.catena.2020.104882
93
Ye J. Wang Y. Kang J. Chen Y. Hong L. Li M. et al (2023). Effects of Long-Term Use of Organic Fertilizer With Different Dosages on Soil Improvement, Nitrogen Transformation, Tea Yield and Quality in Acidified Tea Plantations. Plants12 (1), 122. 10.3390/plants12010122
94
Zhang P. Li Y. Cao Y. Han L. (2019). Characteristics of Tetracycline Adsorption by Cow Manure Biochar Prepared at Different Pyrolysis Temperatures. Bioresour. Technol.285, 121348. 10.1016/j.biortech.2019.121348
95
Zhao Y. Wang X. Yao G. Lin Z. Xu L. Jiang Y. et al (2022). Advances in the Effects of Biochar on Microbial Ecological Function in Soil and Crop Quality. Sustainability14 (16), 10411. 10.3390/su141610411
96
Zhou M. Zhu B. Wang S. Zhu X. Vereecken H. Brüggemann N. (2017). Stimulation of N2O Emission by Manure Application to Agricultural Soils May Largely Offset Carbon Benefits: A Global Meta-Analysis. Glob. Change Biol.23, 4068–4083. 10.1111/gcb.13648
Summary
Keywords
biochar, labile carbon, microbial biomass carbon, soil health, crop production
Citation
Abbas A, Naveed M, Shehzad Khan K, Ashraf M, Siddiqui MH, Abbas N, Mustafa A and Ali L (2024) The Efficacy of Organic Amendments on Maize Productivity, Soil Properties and Active Fractions of Soil Carbon in Organic-Matter Deficient Soil. Span. J. Soil Sci. 14:12814. doi: 10.3389/sjss.2024.12814
Received
06 February 2024
Accepted
09 April 2024
Published
27 June 2024
Volume
14 - 2024
Edited by
Avelino Núñez-Delgado, University of Santiago de Compostela, Spain
Updates
Copyright
© 2024 Abbas, Naveed, Shehzad Khan, Ashraf, Siddiqui, Abbas, Mustafa and Ali.
This is an open-access article distributed under the terms of the Creative Commons Attribution License (CC BY). The use, distribution or reproduction in other forums is permitted, provided the original author(s) and the copyright owner(s) are credited and that the original publication in this journal is cited, in accordance with accepted academic practice. No use, distribution or reproduction is permitted which does not comply with these terms.
*Correspondence: Adnan Mustafa, adnanmustafa780@gmail.com; Muhammad Naveed, muhammad.naveed@uaf.edu.pk
Disclaimer
All claims expressed in this article are solely those of the authors and do not necessarily represent those of their affiliated organizations, or those of the publisher, the editors and the reviewers. Any product that may be evaluated in this article or claim that may be made by its manufacturer is not guaranteed or endorsed by the publisher.