Abstract
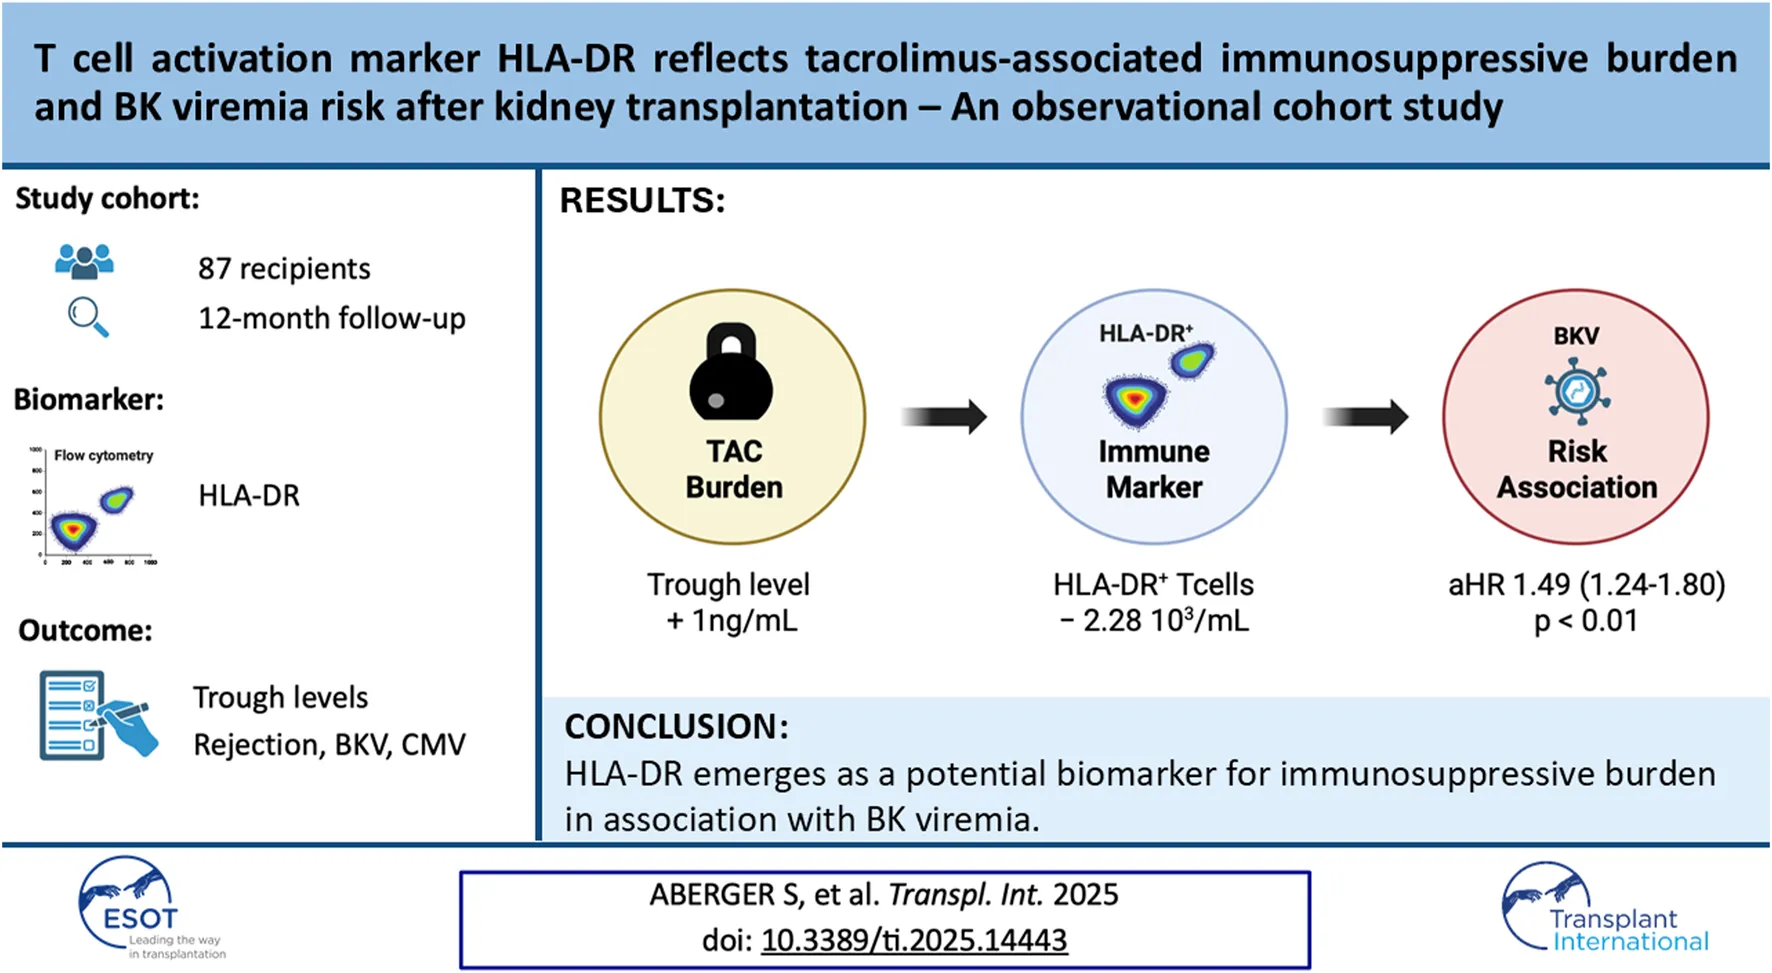
Kidney transplantation (KT) is the current treatment of choice in patients with end-stage kidney disease. Immunosuppression is required to prevent acute rejection but is associated with a high incidence of adverse events. The immunosuppressive burden substantially differs between individuals, necessitating new immune monitoring strategies to achieve personalization of immunosuppression. To compare the evolution of T cell profiles in correlation with immunosuppression and clinical outcomes, 87 kidney transplant recipients were followed for 12 months after KT. Flow cytometry along with assessment of T cell activation markers and clinical data was performed before KT and during study visits 10 days, 2 months and 12 months after KT. Longitudinal T cell phenotyping revealed a significant decrease of T cell activation markers HLA-DR, FCRL3, and CD147 in CD4+ effector T cells after KT. The most pronounced reduction (75%) was found for the activation-proliferation marker HLA-DR, which persisted throughout the observational period. The decrease in HLA-DR expression reflected immunosuppressive burden through strong associations with tacrolimus trough-level exposure (coeff = −0.39, p < 0.01) and BK viremia incidence (coeff = −0.40, p < 0.01) in multivariable regression analysis. T cell activation marker HLA-DR emerges as a potential biomarker for tacrolimus-related immunosuppressive burden in association with BK viremia risk following KT.
Introduction
Kidney transplantation (KT) is the current treatment of choice in patients with kidney failure due to survival benefit and improved quality of life. Despite the administration of high-dose immunosuppressive therapy, acute rejection still affects over 10% of kidney transplant recipients (KTR) within the first 12 months []. Prolonged or repeated exposure to high-dose immunosuppression is associated with frequent adverse events including metabolic complications, susceptibility to infections and increased risk of malignancy []. The trough-level-guided use of calcineurin inhibitors is the cornerstone of T cell suppression in most immunosuppressive regimens. However, the biologically evident level of immunosuppression may vary substantially between individual patients. This variability demands biological effect measures to monitor the overall fitness of the immune system and guide treatment decisions in post-transplant care.
Assessment of the individual immune profile by immune cell phenotyping is currently emerging as a research field with prospects in autoimmunity, oncogenesis, and transplantation []. Single-cell sequencing and spatial transcriptomics of kidney allograft biopsies have been used to elucidate cellular interplay in acute rejection after KT, showing CD4+ and CD8+ T effector cells (Teff) as well as innate immune cells (i.e., natural killer cells) expressing a variety of activation markers (i.e., FcγRIII, FCRL3, CD25, HLA-DR) [, ]. In peripheral blood CD4+ and CD8+ Teff these activation markers have been shown to correlate with antigen-induced proliferation (i.e., HLA-DR) [] and acute rejection (i.e., CD28, HLA-DR) [, ]. On the other hand, CD4+ and CD8+ T cells over-expressing markers of T cell senescence (i.e., TIGIT, LAP) [, ] correlate with exhaustion of donor-specific effector T cells positively impacting long-term graft tolerance [], while activated regulatory CD4+ T cells exert tolerogenic effects already early after KT []. The biological effect of tacrolimus has been demonstrated to significantly impact the differentiation and proliferative capacity of CD4+ T cell populations [], making CD4+ T cells a potential surrogate marker for CNI-associated immunosuppressive burden in translational research. Other immune markers include Torque Tenov viral load starting 2–3 months after KT []. However, appropriate markers especially during the first 8 weeks after KT are still missing.
There is currently a lack of comprehensive data regarding differential biological effects of immunosuppressants on T cell profiles following transplantation. Exploring these changes may i) help to individualize CNI prescription in difficult-to-treat patient subgroups and ii) identify T cell markers correlating with immunosuppressive burden, which could be used as new immune monitoring tools after KT. We therefore chose to conduct a prospective, biologic effect study in a cohort of kidney transplant recipients (KTR) by correlating pharmacological data and clinical outcomes with longitudinal phenotyping of T cell activation markers before and after KT.
Materials and Methods
Study Design and Population
A longitudinal, single-center cohort study evaluating immune cell subpopulations and short-term post-transplant outcomes in 87 KTR was conducted. The study was designed to prospectively enroll low-immunological risk KTR between September 2017 and August 2020 [] (Study flowchart: Supplementary Figure S1). Patients receiving immunosuppression within the past 3 months, AB0-incompatible KT, repeated KT and high immunological risk patients were not included in the study (exclusion criteria are further detailed in the Supplementary Material). All patients received basiliximab or ATG, prednisone, mycophenolate, and tacrolimus per standardized protocols. Blood sampling and clinical data collection were performed pre-transplant (preKT), and at 10 days (D10), 2 months (M2), and 12 months (M12) post-transplant. Complete follow-up was obtained for 87 patients to perform a cohort analysis. The study protocol was approved by the Ethics Committee of the Medical University of Graz, Austria (ID 28-514 × 15/16).
T cell Phenotyping
Flow cytometry was conducted on peripheral blood mononuclear cells (PBMCs) isolated from whole blood samples, collected at study visits. Purified cells were stained with selected monoclonal antibodies (Supplementary Table S1) with BD LSR Fortessa Flow Cytometer (BD Biosciences, USA). T cell phenotyping included CD4+ regulatory T cells (Treg) defined as CD3+CD4+CD127-Foxp3+ according to OMIP-053 by Nowatzky et al [], considering the interaction of Treg marker CD25 with anti-CD25 antibody basiliximab []. CD4+ effector T cells (Teff) were conventionally defined as CD3+CD4+CD25−CD127+CD45RA− and confirmed as being Foxp3- (Supplementary Figure S2). Our selected antibody panels reflecting T cell activation status (including FCRL3, HLA-DR, CD147, CD15s, Ki67) were then separately studied on CD4+ Treg and Teff populations (Supplementary Table S2). Gating and exploration of data using tSNE (t-distributed stochastic neighbor embedding) and FlowSOM/ClusterExplore algorithm were done by FlowJo analysis software (BD Biosciences, USA).
Tacrolimus Data
Tacrolimus dose and trough levels (TL) were recorded weekly to biweekly during the first 12 weeks after KT and at M12. Therapeutic drug monitoring of tacrolimus TL was performed by a validated LC-MS/MS assay. Tacrolimus TL targets were 8–10 ng/mL during the first 2 months and 6–9 ng/mL thereafter. The high granularity of tacrolimus TL data during the first 12 weeks after KT was transposed into a TL trendline. Tacrolimus-associated immunosuppressive burden was then estimated as the area under the curve (AUC) of the tacrolimus TL trendline by trapezoidal rule []. This estimate of cumulative tacrolimus TL exposure referred to as “TL AUC” throughout the manuscript.
Clinical Data
Occurrence and clinical data of biopsy-proven acute rejection (BPAR; using Banff 2019 classification []), CMV viremia (defined as ≥100 copies/mL), and BK-viremia (defined as ≥ 200 copies/mL) were documented at each study visit. Screening for viremia was done according to local practice guidelines every 7–14 days during the first two months, followed by readings every other month during the first year after KT. KTR with CMV D+/R− status received prophylaxis for 6 months, otherwise a preemptive strategy was followed. Kidney biopsies were performed by indication and at the local physician’s discretion only.
Statistical Analysis
Baseline characteristics were summarized using descriptive analysis with mean ± standard deviation (SD) or median with interquartile range (IQR) for continuous variables and frequency tables for categorical variables. Continuous variables were tested for normality with Shapiro–Wilk tests and QQ plots. Parametric and non-parametric tests were used for group comparison where appropriate, with multiplicity adjustment by Holm-Sidak method. For the longitudinal assessment of T cell counts, a linear mixed-effects model was fitted using restricted maximum likelihood (REML) estimation, including time as a fixed effect and patients as random intercepts. Spearman correlation coefficient was used to assess the simple relationships between the independent variables TL AUC and T cell counts.
To further explore the underlying immunologic and pharmacologic relationships in a translational approach, we first assessed whether tacrolimus exposure (TL AUC) was associated with immune activation by modeling HLA-DR+ Teff counts as a dependent variable in a multivariable linear regression, with TL AUC as the main predictor. A cox regression was then used to assess whether HLA-DR+ Teff counts were associated with outcomes (BKV, CMV, BPAR) independent of TL AUC. The proportional hazards assumption using Schoenfeld residuals was confirmed. HLA-DR+ Teff counts measured on day 10 and month 2 post-transplant were modeled as time-dependent covariates, corresponding to event occurrence before and after month 2, respectively. Multivariable models were adjusted for immunosuppression-related confounders with known associations with both the exposures (tacrolimus exposure, T cell counts) and outcomes (BKV, CMV, BPAR), including induction agent, CNI formulation, mean mycophenolate mofetil dose, and cumulative steroid exposure. In addition, we assessed univariable associations of donor- and recipient-related characteristics. Among these, age, sex and KDRI met the inclusion threshold (p <0.20) and were retained in multivariable models to balance clinical relevance with statistical parsimony to minimize overfitting. Time-dependent receiver operating characteristic (tdROC) curve was used to determine the predictive capability and cutoff of T cell counts for BK viremia risk. BK viremia incidence was then displayed by Kaplan-Meier curves above and below the predictive cutoff of day 10 (prior to any event) with log-rank test. All statistical analysis and data visualization was done with R Statistical language (version 4.3.2; R Foundation for Statistical Computing, Vienna, Austria). The following packages were utilized: “tidyverse”, “lme4”, “survminer”, “survival”, “Evalue” and “ggplot2”. A p-value <0.05 was considered statistically significant.
Results
Characteristics of the Study Cohort
Recipients were of Caucasian ethnicity (>90%), with a male preponderance (63%) and a median pretransplant dialysis vintage of 29 months (Table 1). The median recipient age was 59 years, the mean recipient BMI was 27 and the median KDRI was 1.15 (Table 1). Patients received basiliximab (94.3%) or low-dose ATG (5.7%) for induction, with an initial tacrolimus daily-dose of 0.1 mg/kg, alongside corticosteroids and mycophenolic acid for maintenance by standard protocol. Patients receiving ATG tended to be younger with a higher number of HLA-mismatches (Supplementary Table S3). Mean tacrolimus TL was 10.2 (±3.1) ng/mL at day 10, decreasing to 6.3 (±1.3) ng/mL by M12 (Supplementary Table S4). Recorded events included BPAR n = 16 (15 TCMR, 1 mixed TCMR-ABMR, median time-to-event 14 days), BKV n = 21 (median peak-level 1.1 log4 and time-to-event 59 days) and CMV n = 48 (median peak-level 1.3 log3 and time-to-event 67 days), (Supplementary Table S5; Supplementary Figure S7).
TABLE 1
| Recipient characteristics | N = 87 | |
|---|---|---|
| Female N (%) Male N (%) | 32 (36.8%) 55 (63.2%) | |
| Age [years] MDN (IQR) | 59 (53–66) | |
| BMI [kg/m2] MDN (IQR) | 27.9 (23.6–29.1) | |
| Hemodialysis | 71 (82%) | |
| Peritoneal dialysis | 13 (14.7%) | |
| Preemptive transplantation | 3 (3.3%) | |
| Dialysis vintage [mo] (MDN ± IQR) | 29 (24–35) | |
| Diabetes mellitus | 16 (18%) | |
| Arterial hypertension | 84 (97%) | |
| ADPKD | 16 (18.4%) | |
| Ethnicity N (%) | ||
| Caucasian Turkish Asian Other | 82 (94%) 2 (2.4%) 1 (1.2%) 2 (2.4%) | |
| Donor characteristics | N = 87 | |
|---|---|---|
| Age [years] MDN (IQR) | 57.5 (49–67) | |
| BMI [kg/m2] MDN (IQR) | 26.2 (24.1–28.5) | |
| Expanded-criteria donor | 51 (58.6%) | |
| Donor after cardiac death | 4 (4.6%) | |
| KDRI MDN (IQR) | 1.15 (1.02–1.23) | |
| HLA mismatch N (%) | ||
| 0 1 2 3 4 5 6 | 2 (2.3%) 4 (3.4%) 6 (6.7%) 24 (28.6%) 35 (40.6%) 15 (17.2%) 1 (1.2%) | |
| Immunosuppression | N = 87 | |
|---|---|---|
| Induction agent | ||
| Basiliximab | 82 (94.3%) | |
| Anti-thymocyte globulin | 5 (5.7%) | |
| Maintenance regime | ||
| Glucocorticoids | 87 (100%) | |
| Mycophenolic acid | 87 (100%) | |
| Tacrolimus | Twice daily | 55 (63.2%) |
| Once daily | 32 (36.8%) | |
Donor and recipient characteristics with immunosuppressive regimes are presented as mean (M) ± standard deviation (SD) when normally distributed and otherwise as median (MDN) and interquartile range (IQR) or absolute number (N) with relative percentage (%) for the whole cohort.
T cell Activation Marker HLA-DR Identifies Effector T cells Susceptible to Tacrolimus
To identify CD4+ T cell subpopulations changing after induction therapy, we compared CD4+ Teff and CD4+ Treg immediately before transplantation (preKT) and 2 months after transplantation (M2) by unsupervised cluster-based analysis stratified by T cell activation status.
Among CD4+ Teff, activated clusters expressing activation markers CD147high, FCRL3+ and HLA-DR+ were significantly reduced at M2, while non-proliferating and naive CD45RA+ T cell clusters did not change (Figure 1A). Quantitative, longitudinal comparison of T cell subsets identified only HLA-DR+ Teff to significantly decrease already at D10 after KT and remain significantly reduced until M12 (Figures 1B–D), while FCRL3+ and CD147high Teff returned to baseline by M12 (Supplementary Figure S3). Calculation of the relative change from baseline revealed that the nadir of HLA-DR+ Teff counts was reached at D10 (−75.6% from baseline), and cell counts showed an increasing trend at M2 (−64.7% from baseline), however, they remained significantly decreased at M12 (−22.3% from baseline), (Supplementary Table S6).
FIGURE 1
Among CD4+ Treg, a transient decrease of proliferative and activated Foxp3+CD45RA−CD15s+ effector Treg after KT with a general shift towards a CD45RA+CD15s− resting phenotype (Figure 2A) was noted. However, proliferative and effector Treg were fully replenished by M2 or between M2 and M12 (Figures 2B-E), and expression of Foxp3 followed the same trend (Supplementary Figure S4). The known interference of basiliximab with anti-CD25 monoclonal antibodies was evident at D10 and M2 in contrast to patients treated with ATG, however, no major differences were found in Foxp3+ Treg and HLADR+ Teff subsets (Supplementary Figure S5).
FIGURE 2
We next sought to explore the sustained decrease in HLA-DR+ Teff counts by testing the relation between cell quantity and immunosuppressive burden. Slope analysis of mean tacrolimus TL and HLA-DR+ Teff counts over 12 months revealed a decrease of 2.28 × 10³/mL cells per 1 ng/mL increase in tacrolimus TL (Supplementary Table S4). A strong negative correlation between tacrolimus burden, estimated as TL AUC (Figure 3A), and the HLA-DR+ Teff counts during the first weeks until M2 after KT was observed (r = −0.70, p = 0.008; Figure 3B). To account for potential confounders related to recipient characteristics, donor quality, and the immunosuppressive regimen, we performed multivariable linear regression. The significant association between HLA-DR+ Teff counts, and TL AUC remained robust across all models (β-coefficient = −0.39, p = 0.0002), (Table 2; Supplementary Table S7). No correlation was found for proliferative-effector Treg counts (Figure 3C).
FIGURE 3
TABLE 2
| Association of HLA-DR + Teff counts and TL exposure | ||||
|---|---|---|---|---|
| Model | Coefficient | 95% CI | p-value | R-squared |
| Crude. | −0.419 | −0.531 to −0.310 | 2.613 e-07 | 0.504 |
| Model 1 | −0.433 | −0.523 to −0.303 | 5.021 e-06 | 0.552 |
| Model 2 | −0.403 | −0.503 to −0.301 | 5.020 e-06 | 0.510 |
| Model 3 | −0.390 | −0.528 to −0.310 | 2.612 e-04 | 0.484 |
HLA-DR+ Teff counts adjusted for recipient-, donor- and treatment-related covariates is associated with TL exposure.
Multivariable linear regression was used to adjust the crude association of HLA-DR+ Teff counts (dependent variable) and TL AUC for covariates; Model 1 = adjusted for sex + age; Model 2 = adjusted for Model 1+ KDRI; Model 3 = adjusted for Model 2 + ATG + TAC formulation +mean MMF dose + cumulative prednisolone dose.
T cell Activation Marker HLADR Is Independently Associated With BK Viremia Risk
We further investigated outcome-oriented associations between the T-cell activation marker HLA-DR and immune-related events, including BK viremia, CMV infection, and BPAR. The HLA-DR+ Teff counts were significantly lower in patients who developed BK viremia compared to those who did not (Figure 4A). A similar trend was observed for CMV, although statistical significance was not reached (p = 0.09), while no difference was noted for BPAR (Figure 4A). Again, no difference was found for proliferative-effector Treg counts (Figure 4B). To assess the association between HLA-DR+ Teff counts and BKV, CMV, and acute rejection (AR), a time-dependent multivariable cox regression was performed and adjusted for TL AUC and confounders. The significant association between HLA-DR+ Teff counts and BKV remained independent from TL AUC and confounders (fully adjusted HR = 1.49, p = 0.00002), (Table 3). No significant associations were identified between HLA-DR+ Teff counts and the occurrence of CMV or BPAR (Table 3).
FIGURE 4
TABLE 3
| Association of Outcome variables with HLA-DR + Teff counts | |||||
|---|---|---|---|---|---|
| Outcome | Model | Events/Total (Censored) | Coefficient | HR (95% CI) | p-value |
| BKV | Crude. | 21/87 (66) | −0.717 | 0.488 (0.31–0.63) | 0.00002 |
| Model 1 | −0.425 | 0.654 (0.51–0.80) | 0.0001 | ||
| Model 2 | −0.377 | 0.686 (0.57–0.83) | 0.0005 | ||
| Model 3 | −0.402 | 0.669 (0.55–0.81) | 0.0001 | ||
| CMV | Crude. | 48/87 (39) | −0.119 | 0.88 (0.67–1.17) | 0.230 |
| Model 1 | −0.080 | 0.91 (0.83–1.11) | 0.594 | ||
| Model 2 | 0.016 | 1.03 (0.97–1.09) | 0.774 | ||
| Model 3 | −0.055 | 0.96 (0.90–1.03) | 0.640 | ||
| BPAR | Crude. | 16/87 (71) | 0.060 | 1.04 (0.83–1.20) | 0.189 |
| Model 1 | 0.058 | 1.03 (0.86–1.20) | 0.189 | ||
| Model 2 | 0.063 | 1.07 (0.88–1.19) | 0.174 | ||
| Model 3 | 0.067 | 1.08 (0.89–1.20) | 0.177 | ||
BKV adjusted for TL exposure and covariates is independently associated with HLA-DR+ Teff counts.
Time-dependent multivariable cox regression was used to test the association of HLA-DR+ Teff counts for the outcomes BKV, CMV, and BPAR. The crude model includes only HLADR+ Teff, Model 1 = adjusted for TL AUC, Model 2 = adjusted for Model 1 + age + sex + KDRI; Model 3 = adjusted for Model 2 + ATG + TAC formulation +mean MMF dose + cumulative prednisolone dose.
Predicted probabilities of BKV by HLA-DR+ Teff counts were modeled from cox regression and depicted with a best-fit line to show the increase in BKV risk with decreasing HLA-DR+ Teff counts (Figure 5A). Time-dependent Receiver operating characteristic (ROC) analysis revealed an AUC of 0.75 (p = 0.001), with a specificity of 63% and sensitivity of 85% for an HLA-DR+ Teff count of 4.71 × 10³ cells/mL at day 10 (Supplementary Figure S6). Stratification of the cohort based on HLA-DR+ Teff count above and below this cutoff demonstrated a significant difference in viremia-free survival, as shown by Kaplan-Meier curve analysis (Figure 5B).
FIGURE 5
Discussion
This observational cohort study employs longitudinal T cell phenotyping to identify immune markers correlating with immunosuppressive burden and clinical outcomes after KT. The study cohort included 87 prospectively enrolled, immunologically low-risk KTR receiving basiliximab- (94%) or ATG-based (6%) induction therapy with triple immunosuppressive maintenance therapy (steroids, tacrolimus, and mycophenolic acid). Suppression of T cell activation marker HLA-DR was associated with tacrolimus burden and was markedly aggravated in patients developing BK viremia, emerging as a potential immune monitoring tool.
Unsupervised cluster-based analysis of CD4+ Teff revealed significant changes among T cell activation markers following KT. The immediate decrease of HLA-DR+ CD4+ Teff already at D10 indicated an early suppression of T cell proliferation, as HLA-DR expression has been shown to reflect T cell proliferative capacity with antigen stimulation after KT []. In contrast, other activation markers, such as FCRL3, and CD147 demonstrated a delayed timeline for observable change. In line with this observation, CNIs have been shown to decrease T cell proliferative capacity in stimulation assays []. However, stimulation assays are hampered by frequent preanalytical errors in clinical practice, underscoring the added practical value of using flow cytometry to provide a feasible indicator of the efficacy of immunosuppressive therapy in a real-world setting. In our study, the consistent, inverse relationship between TL exposure and HLA-DR+ Teff counts suggests a dose-dependent reduction of T cell quantity. The association between HLA-DR+ Teff counts and tacrolimus TL AUC remained robust even after adjusting for potential confounders. Together, these findings support that HLA-DR+ Teff count may serve as a surrogate biological measure of a CNI dose-immune effect. Notably, the observable changes in HLA-DR+ Teff cell counts within the first two months could complement other immune monitoring tools, such as TTV, which typically exhibit delayed responses to immunosuppression early after KT [].
Building on this background, the use of tacrolimus TL AUC in our study may provide a more accurate estimation of immunosuppressive burden compared to single or averaged TL measurements. Recent evidence suggests that TL AUC reflects the immunosuppressive burden of CNI-based regimens, with demonstrated correlations to TTV levels and BK viremia risk in a retrospective cohort analysis of kidney transplant recipients []. The strong, inverse association between HLADR+ Teff cell counts and tacrolimus TL AUC in our study reflects these findings. However, the practical application of TL AUC is limited by its retrospective nature and the need for high data granularity, highlighting the importance of identifying a feasible and reliable surrogate marker for clinical monitoring and adverse event prediction. TTV viral load is currently evaluated as a promising immune monitoring tool after a calibration period of 8 weeks after KT [].
In our study, the association between BK viremia and HLA-DR+ Teff counts remained robust after adjustment for TL AUC and confounding variables. This independent association as early as day 10 after KT is particularly intriguing, given that reduction of immunosuppression remains the mainstay of BKV management and could suggest that early reduction of immunosuppression could mitigate viremia in at-risk patients. Currently, our findings build a biologically plausible association between tacrolimus-based immunosuppression and activated T cell quantity reflected by immune marker HLA-DR, and BK viremia. Based on this association, the observed decrease of 2.28 × 10³/mL in HLA-DR+ Teff cells per 1 ng/mL increase in tacrolimus TL over time provides valuable pilot data for estimating effect sizes in future studies. However, these findings are preliminary evidence and support the development of prospective investigations to validate and test HLA-DR+ Teff count as a biomarker for immunosuppressive burden to mitigate adverse events early after KT.
Previous studies have demonstrated that induction with the anti-CD25 monoclonal antibody basiliximab influences Treg activation markers in CD4+ Treg [], yet without impacting functionality []. This was confirmed by the absence of CD25+ Treg at day 10 in basiliximab-treated patients, whereas CD25+ Treg in ATG-treated patients and Foxp3+ Treg in the whole cohort were detectable. Concerning the evolution of Foxp3+ Treg, we observed a transient decrease of activated and proliferative Treg markers following induction therapy, with reconstitution by month 2 or between month 2 and month 12. Previous studies suggested prognostic relevance of Teff/Treg ratio predicting acute rejection after KT [], however, the reduction of Teff cells was overall stronger than the reduction of Treg in our study. In addition, there was no significant correlation between proliferative Treg subsets and TL-AUC, and no differences were found for clinical outcomes.
From a pathomechanistic view, the stronger association between HLA-DR+CD4+ Teff cells and BK viremia, compared to CMV infection, is noteworthy. It may reflect fundamental differences in host immune responses, suggesting a critical role of CD4+ T cell immunity in the development of BK viremia. This is consistent with emerging strategies to restore BKV-specific immunity, including the use of allogeneic CD4+ T-cell therapy []. Furthermore, the decrease in HLADR+ Teff counts with higher tacrolimus burden and BK viremia risk in our cohort aligns with findings from a previous observational study, suggesting a “CNI-first” approach to immunosuppression reduction as an effective treatment strategy for BK viremia and nephropathy []. Contrarily, a more pronounced involvement of CD8+ T-cell-mediated immunity in CMV control has been suggested [], as current investigations into interferon-gamma release assays as a monitoring tool for CD8+ cellular immunity aim to guide decisions regarding pre-emptive or prophylactic therapy for CMV [27]. Similarly, TTV viral load is under evaluation as a potential immune monitoring tool for CNI-based immunosuppression, with predictive value for immune-related adverse events [].
Finally, we identified a predictive threshold for HLA-DR+ Teff counts to stratify kidney transplant recipients (KTR) at risk of developing BK viremia. Specifically, an HLA-DR+ Teff count below 4.7 × 10³/mL at day 10 post-transplantation was associated with meaningful risk prediction for BK viremia (median time to event: 59 days), potentially justifying early adjustment of immunosuppressive therapy. A comparable strategy has been reported in a prospective study, where the pretransplant abundance of CD28+ T cells was shown to predict acute rejection risk in patients receiving belatacept (an anti-CD28 monoclonal antibody) compared to tacrolimus []. In this regard, our findings remain exploratory and provide preliminary data to support future studies investigating the utility of immune marker-guided CNI dosing and T-cell phenotyping as predictive tools for mitigating viral and immunological complications following kidney transplantation.
Limitations of our study include a small sample size, albeit comparable to other studies in the field. Nonetheless, a total of 348 blood samples for flow cytometry and more than 900 tacrolimus TL data were sufficient for comprehensive analysis. The prospective setting and the use of adjusted regression models to show a dose-immune effect strengthen the internal validity of our study. This analytical strategy was designed to reflect a biologically plausible and mechanistic pathway; however, causality can not be claimed, and residual confounding can not be entirely excluded. For sensitivity analysis, E-value analysis for the adjusted HR of 1.49 for BK viremia was 2.3 (1.8 lower bound), indicating that any unmeasured confounder would need to have a relative risk of at least 2.3 with both HLA-DR expression and BK viremia to fully account for the observed effect. Furthermore, the single-centre design with representation of a central European cohort may limit the overall comparability of our results. Therefore, we acknowledge that our results need further external validation, ideally with additional external cohorts and confirmation by a larger, multicentric trial. We also have to acknowledge that the implementation of flow cytometry may be hampered by technical reproducibility in clinical routine, and a higher frequency of flow cytometric measurements could have improved the granularity of the data. Our study does not include protocol biopsies, de novo DSA, tacrolimus single-dose AUC, T cell phenotyping of the CD8+ lineage, or T cell stimulation assays, which could be the subject of a follow-up study.
In conclusion, T cell activation marker HLA-DR emerges as a potential biomarker for tacrolimus-associated immunosuppressive burden, yielding a strong association with BK viremia risk following kidney transplantation.
Statements
Data availability statement
The original contributions presented in the study are included in the article/Supplementary Material, further inquiries can be directed to the corresponding author.
Ethics statement
The studies involving humans were approved by Ethics committee Medical University of Graz, Austria (ID 28-514ex 15/16). The studies were conducted in accordance with the local legislation and institutional requirements. The participants provided their written informed consent to participate in this study.
Author contributions
SA, KA, VP, BP, AR, and KE participated in research design, performance of the research, data analysis, statistical analysis and writing of the paper. SA, MS, AM, AK, and KK participated in patient recruitment, data analysis and writing of the paper. All authors contributed to the article and approved the submitted version.
Funding
The author(s) declare that financial support was received for the research and/or publication of this article. This work was supported by the Austrian National Bank OeNB (Nr.17212 to KE), by an investigator-initiated research grant by Chiesi to KE and by the European Union’s Horizon 2020 research and innovation program under grant agreement number 896932 (TTVguideTX project consortium; consortium lead: Medical University of Vienna, Gregor Bond).
Conflict of interest
KE received an investigator-initiated research grant by Chiesi, congress-support and speaker fees by Chiesi and Astellas.
The remaining authors declare that the research was conducted in the absence of any commercial or financial relationships that could be construed as a potential conflict of interest.
Generative AI statement
The author(s) declare that no Generative AI was used in the creation of this manuscript.
Supplementary material
The Supplementary Material for this article can be found online at: https://www.frontierspartnerships.org/articles/10.3389/ti.2025.14443/full#supplementary-material
References
1.
ThomuschOWiesenerMOpgenoorthMPascherAWoitasRPWitzkeOet alRabbit-ATG or Basiliximab Induction for Rapid Steroid Withdrawal after Renal Transplantation (Harmony): An Open-Label, Multicentre, Randomised Controlled Trial. Lancet (2016) 388(10063):3006–16. 10.1016/s0140-6736(16)32187-0
2.
VajdicCMMcDonaldSPMcCredieMREvan LeeuwenMTStewartJHLawMet alCancer Incidence before and after Kidney Transplantation. JAMA (2006) 296(23):2823–31. 10.1001/jama.296.23.2823
3.
PreglejTBrinkmannMSteinerGAletahaDGöschlLBonelliM. Advanced Immunophenotyping: A Powerful Tool for Immune Profiling, Drug Screening, and a Personalized Treatment Approach. Front Immunol (2023) 14:1096096. 10.3389/fimmu.2023.1096096
4.
LamarthéeBCallemeynJVan HerckYAntoranzAAnglicheauDBoadaPet alTranscriptional and Spatial Profiling of the Kidney Allograft Unravels a Central Role for FcyRIII+ Innate Immune Cells in Rejection. Nat Commun (2023) 14(1):4359. 10.1038/s41467-023-39859-7
5.
ShiTBurgARCaldwellJTRoskinKMCastro-RojasCMChukwumaPCet alSingle-Cell Transcriptomic Analysis of Renal Allograft Rejection Reveals Insights into Intragraft TCR Clonality. J Clin Invest (2023) 133(14):e170191. 10.1172/JCI170191
6.
LitjensNHRvan der ListACJKlepperMPrevooFBoerKHesselinkDAet alPolyfunctional Donor-Reactive T Cells Are Associated with Acute T-Cell-Mediated Rejection of the Kidney Transplant. Clin Exp Immunol (2023) 213(3):371–83. 10.1093/cei/uxad041
7.
SabekODorakMTKotbMGaberAOGaberL. Quantitative Detection of T-Cell Activation Markers by Real-Time PCR in Renal Transplant Rejection and Correlation with Histopathologic Evaluation. Transplantation (2002) 74(5):701–7. 10.1097/00007890-200209150-00019
8.
Cortes-CerisueloMLaurieSJMathewsDVWinterbergPDLarsenCPAdamsABet alIncreased Pretransplant Frequency of CD28+ CD4+ TEM Predicts Belatacept-Resistant Rejection in Human Renal Transplant Recipients. Am J Transplant (2017) 17(9):2350–62. 10.1111/ajt.14350
9.
van der ListACJLitjensNHRKlepperMBetjesMGH. Expression of Senescence Marker TIGIT Identifies Polyfunctional Donor-Reactive CD4+ T Cells Preferentially Lost after Kidney Transplantation. Front Immunol (2021) 12:656846. 10.3389/fimmu.2021.656846
10.
LiSLuHSellaRZhangWDongHGuoCet alThe Effects of Anti-LAP Monoclonal Antibody Down-Regulation of CD4+LAP+ T Cells on Allogeneic Corneal Transplantation in Mice. Scientific Rep (2018) 8(1):8021. 10.1038/s41598-018-26235-5
11.
Del BelloAGouinAChaubetCKamarNTreinerE. The CD226/TIGIT axis Is Involved in T Cell Hypo-Responsiveness Appearance in Long-Term Kidney Transplant Recipients. Sci Rep (2022) 12(1):11821. 10.1038/s41598-022-15705-6
12.
Martin-MorenoPLTripathiSChandrakerA. Regulatory T Cells and Kidney Transplantation. Clin J Am Soc Nephrol (2018) 13(11):1760–4. 10.2215/CJN.01750218
13.
KannegieterNMHesselinkDADieterichMde GraavGNKraaijeveldRBaanCC. Differential T Cell Signaling Pathway Activation by Tacrolimus and Belatacept after Kidney Transplantation: Post Hoc Analysis of a Randomised-Controlled Trial. Scientific Rep (2017) 7(1):15135. 10.1038/s41598-017-15542-y
14.
HaupenthalFRahnJMaggiFGelasFBourgeoisPHugoCet alA Multicentre, Patient- and Assessor-Blinded, Non-Inferiority, Randomised and Controlled Phase II Trial to Compare Standard and Torque Teno Virus-Guided Immunosuppression in Kidney Transplant Recipients in the First Year after Transplantation: TTVguideIT. Trials (2023) 24(1):213. 10.1186/s13063-023-07216-0
15.
MooslechnerAASchullerMPfeiferVKlötzerKAPrietlBKirschAHet alPre-Transplant Frequencies of FoxP3(+)CD25(+) in CD3(+)CD8(+) T Cells as Potential Predictors for CMV in CMV-Intermediate Risk Kidney Transplant Recipients. Transpl Int (2024) 37:12963. 10.3389/ti.2024.12963
16.
NowatzkyJStagnarCManchesO. OMIP-053: Identification, Classification, and Isolation of Major FoxP3 Expressing Human CD4(+) Treg Subsets. Cytometry A (2019) 95(3):264–7. 10.1002/cyto.a.23704
17.
CheungJZahorowskaBSuranyiMWongJKWDiepJSpicerSTet alCD4(+)CD25(+) T Regulatory Cells in Renal Transplantation. Front Immunol (2022) 13:1017683. 10.3389/fimmu.2022.1017683
18.
EderMSchragTAHavelEFKainzAOmicHDobererKet alPolyomavirus Nephropathy in ABO Blood Group-Incompatible Kidney Transplantation: Torque Teno Virus and Immunosuppressive Burden as an Approximation to the Problem. Kidney Int Rep (2024) 9:1730–41. 10.1016/j.ekir.2024.04.003
19.
LoupyAHaasMRoufosseCNaesensMAdamBAfrouzianMet alThe Banff 2019 Kidney Meeting Report (I): Updates on and Clarification of Criteria for T Cell- and Antibody-Mediated Rejection. Am J Transpl (2020) 20(9):2318–31. 10.1111/ajt.15898
20.
LaskinBLJiaoJBaluarteHJAmaralSFurthSLAkimovaTet alThe Effects of Tacrolimus on T-Cell Proliferation Are Short-Lived: A Pilot Analysis of Immune Function Testing. Transpl Direct (2017) 3(8):e199. 10.1097/TXD.0000000000000715
21.
DobererKSchiemannMStrasslRHaupenthalFDermuthFGörzerIet alTorque Teno Virus for Risk Stratification of Graft Rejection and Infection in Kidney Transplant Recipients-A Prospective Observational Trial. Am J Transpl (2020) 20(8):2081–90. 10.1111/ajt.15810
22.
KrystufkovaESekerkovaAStrizIBrabcovaIGirmanovaEViklickyO. Regulatory T Cells in Kidney Transplant Recipients: The Effect of Induction Immunosuppression Therapy. Nephrol Dial Transplant (2012) 27(6):2576–82. 10.1093/ndt/gfr693
23.
VondranFWTimrottKTrossJKollrichSSchwarzALehnerFet alImpact of Basiliximab on Regulatory T-Cells Early after Kidney Transplantation: Down-Regulation of CD25 by Receptor Modulation. Transpl Int Switzerland (2010) 23:514–23. 10.1111/j.1432-2277.2009.01013.x
24.
DekeyserMde Goër de HerveMGHendel-ChavezHLhotteRScriabineIBargielKet alAllogeneic CD4 T Cells Sustain Effective BK Polyomavirus-Specific CD8 T Cell Response in Kidney Transplant Recipients. Kidney Int Rep (2024) 9(8):2498–513. 10.1016/j.ekir.2024.04.070
25.
BischofNHirschHHWehmeierCAmicoPDickenmannMHirt-MinkowskiPet alReducing Calcineurin Inhibitor First for Treating BK Polyomavirus Replication after Kidney Transplantation: Long-Term Outcomes. Nephrol Dial Transpl (2019) 34(7):1240–50. 10.1093/ndt/gfy346
26.
PickeringHSenSArakawa-HoytJIshiyamaKSunYParmarRet alNK and CD8+ T Cell Phenotypes Predict Onset and Control of CMV Viremia after Kidney Transplant. JCI Insight (2021) 6(21):e153175. 10.1172/jci.insight.153175
27.
De Gracia-GuindoMDCRuiz-FuentesMDCGalindo-SacristánP. Cytomegalovirus Infection Monitoring Based on Interferon Gamma Release Assay in Kidney Transplantation. Transplant Proc (2018). p. 578–80. 10.1016/j.transproceed.2017.09.052
Summary
Keywords
immune monitoring, immunosuppression, kidney transplantation, translational nephrology, personalized medicine
Citation
Aberger S, Schuller M, Mooslechner AA, Klötzer KA, Prietl B, Pfeifer V, Kirsch AH, Rosenkranz AR, Artinger K and Eller K (2025) T cell Activation Marker HLA-DR Reflects Tacrolimus-Associated Immunosuppressive Burden and BK Viremia Risk After Kidney Transplantation – An Observational Cohort Study. Transpl. Int. 38:14443. doi: 10.3389/ti.2025.14443
Received
04 February 2025
Accepted
03 July 2025
Published
17 July 2025
Volume
38 - 2025
Updates
Copyright
© 2025 Aberger, Schuller, Mooslechner, Klötzer, Prietl, Pfeifer, Kirsch, Rosenkranz, Artinger and Eller.
This is an open-access article distributed under the terms of the Creative Commons Attribution License (CC BY). The use, distribution or reproduction in other forums is permitted, provided the original author(s) and the copyright owner(s) are credited and that the original publication in this journal is cited, in accordance with accepted academic practice. No use, distribution or reproduction is permitted which does not comply with these terms.
*Correspondence: Katharina Artinger, katharina.artinger@medunigraz.at
Disclaimer
All claims expressed in this article are solely those of the authors and do not necessarily represent those of their affiliated organizations, or those of the publisher, the editors and the reviewers. Any product that may be evaluated in this article or claim that may be made by its manufacturer is not guaranteed or endorsed by the publisher.