Abstract
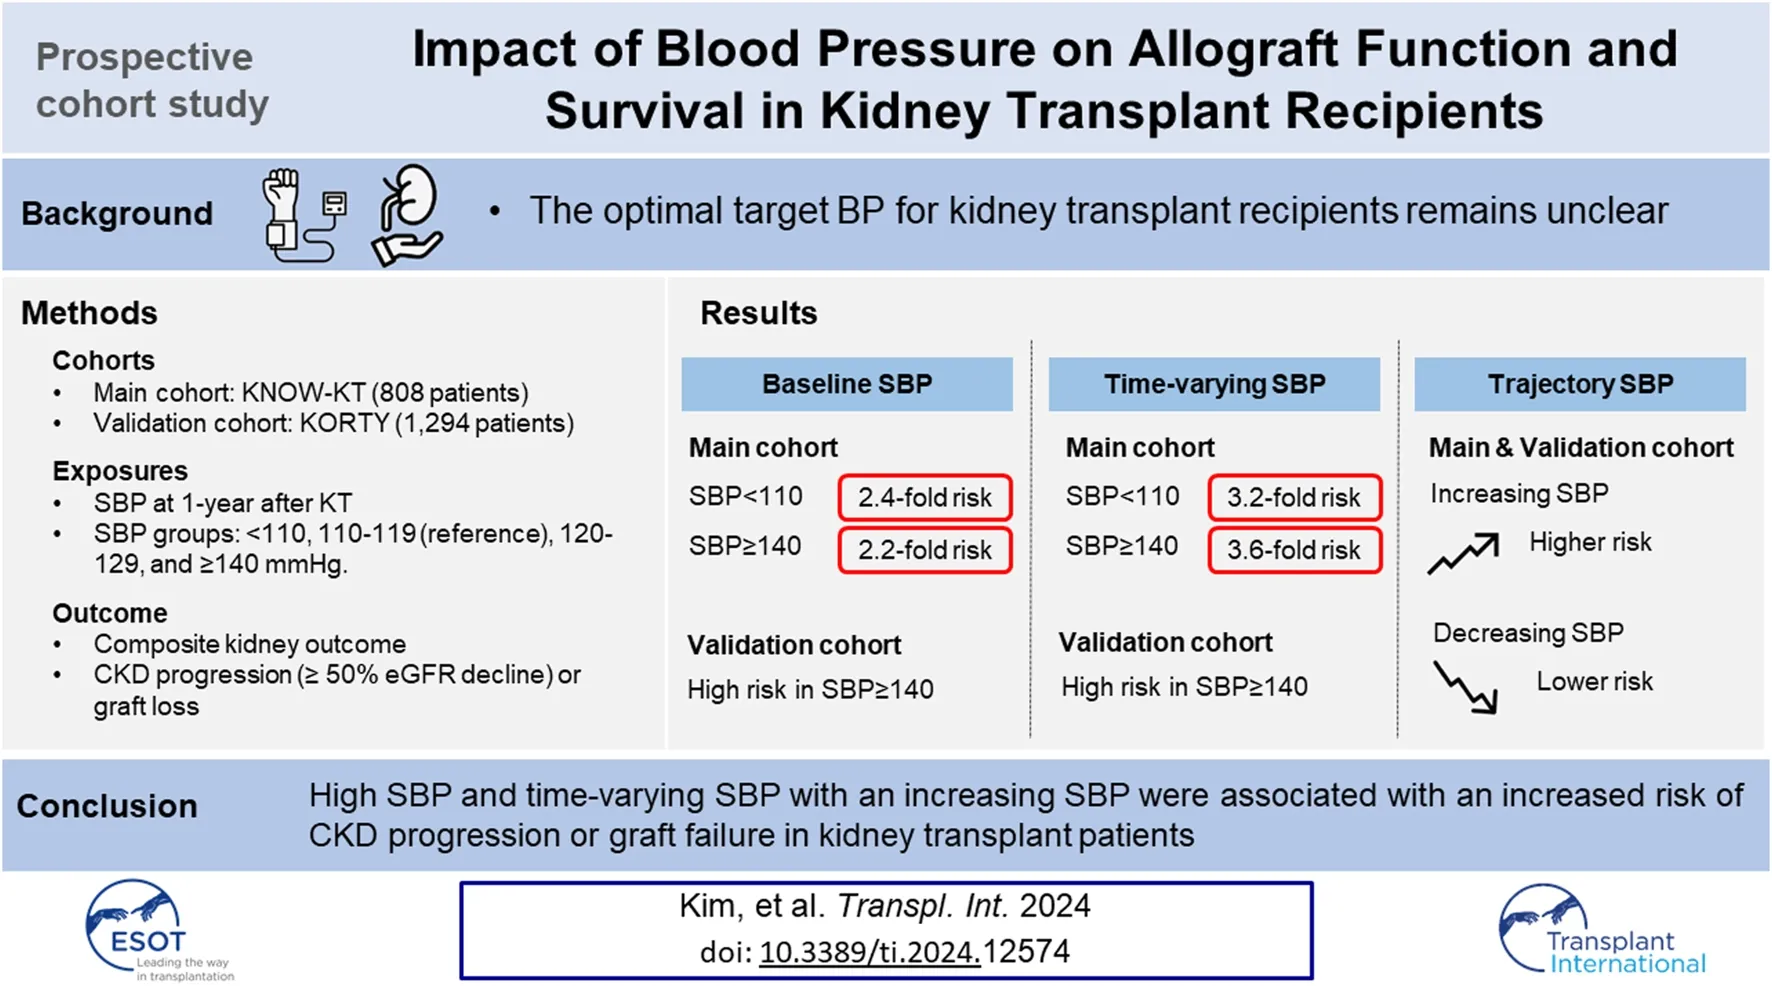
The optimal target blood pressure for kidney transplant (KT) patients remains unclear. We included 808 KT patients from the KNOW-KT as a discovery set, and 1,294 KT patients from the KOTRY as a validation set. The main exposures were baseline systolic blood pressure (SBP) at 1 year after KT and time-varying SBP. Patients were classified into five groups: SBP <110; 110–119; 120–129; 130–139; and ≥140 mmHg. SBP trajectories were classified into decreasing, stable, and increasing groups. Primary outcome was composite kidney outcome of ≥50% decrease in eGFR or death-censored graft loss. Compared with the 110–119 mmHg group, both the lowest (adjusted hazard ratio [aHR], 2.43) and the highest SBP (aHR, 2.25) were associated with a higher risk of composite kidney outcome. In time-varying model, also the lowest (aHR, 3.02) and the highest SBP (aHR, 3.60) were associated with a higher risk. In the trajectory model, an increasing SBP trajectory was associated with a higher risk than a stable SBP trajectory (aHR, 2.26). This associations were consistent in the validation set. In conclusion, SBP ≥140 mmHg and an increasing SBP trajectory were associated with a higher risk of allograft dysfunction and failure in KT patients.
Introduction
Post-transplant hypertension is one of the most common complications after kidney transplantation (KT). The prevalence of hypertension in kidney transplant recipients (KTRs) is reported to be approximately 50%–90% [, ]. Its risk factors include not only chronic kidney disease (CKD)-related risk factors, such as activation of the renin-angiotensin-aldosterone system (RAS), sympathetic nerve activity, and extracellular fluid volume expansion, but also KT-specific factors, such as calcineurin inhibitors (CNIs), corticosteroids, transplant renal artery stenosis, and angiotensin II type 1-receptor activating antibodies [–].
Hypertension is a well-recognized major risk factor for post-transplant cardiovascular diseases (CVD) such as congestive heart failure, ischemic heart disease, and stroke in KTRs [–]. Hypertension is also an independent risk factor for kidney function decline, and poor graft survival. In experimental studies, hypertension accelerates the progression of kidney failure by elevating glomerular capillary hydrostatic pressure and glomerular hyper-perfusion [, ]. Notably, grafted kidneys with vascular damage are likely to be susceptible to mechanical injury, which accelerates immune-mediated injury. Several clinical studies have shown the negative effect of hypertension on graft outcomes [, , ]. In an observational cohort study of living donor KTRs, the BP during the first year after KT was a significant risk factor for allograft failure, independent of kidney function [].
Therefore, management of hypertension after KT is imperative to improve graft survival and patient survival. However, the optimal target BP for KTRs remains unclear. The SPRINT study recommended strict SBP control <120 mmHg for the reduction of cardiovascular events as well as mortality. A post hoc study of SPRINT also showed that intensive SBP control <120 mmHg decreased cardiovascular events in CKD patients [, ]. However, the ACCORD study did not find beneficial effects of strict BP control on cardiovascular events and mortality in diabetic CKD patients []. In the 2021 Kidney Disease Improving Global Outcomes (KDIGO) BP guidelines, the target BP for CKD patients was lowered to SBP <120 mmHg according to the SPRINT, whereas the target BP for KTRs was maintained at <130/80 mmHg []. No randomized controlled clinical trials (RCTs) have examined the effect of BP on CVD outcome, graft survival, or mortality in KTRs []. Therefore, we investigated the association between SBP and kidney outcomes in a large prospective cohort of KTRs.
Patients and Methods
Study Design and Participants
The Korean Cohort Study for Outcome in Patients with Kidney Transplantation (KNOW-KT) is a multicenter, observational cohort study that investigated graft and patient outcomes along with risk factors in Korean KT patients []. A total of 1,080 participants were enrolled from eight Korean transplantation centers between July 2012 and August 2016 and followed up annually. We excluded 11 patients who suffered graft loss within 1 year of KT, 100 patients who had no follow-up at 1-year after KT (baseline), and 20 patients who underwent baseline examination only without subsequent visits thereafter. Moreover, patients with missing baseline SBP (n = 21), estimated glomerular filtration rate (eGFR) (n = 8), demographic (n = 83), and laboratory data (n = 29) were excluded. As a result, the final analysis included 808 patients (Figure 1). A total of 748 patients were enrolled in the trajectory analysis model, excluding an additional 60 patients without BP readings during the exposure period (Figure 1).
FIGURE 1
The Korean Organ Transplantation Registry (KOTRY), a nationwide cohort for organ transplantation in Korea, prospectively collected data on organ transplantation recipients and donors []. The KTRs between 2014 and 2020 in KOTRY were used as a validation cohort in this study. Among 7,675 eligible patients, we excluded 6,381 patients for the following reasons: graft loss within 1 year after KT (n = 78), no follow-up at 1-year after KT (n = 2,136), no subsequent visit after baseline visit (n = 672), and missing baseline SBP (n = 805), eGFR (n = 502), demographic data (n = 522), and laboratory data (n = 1,666). As a result, 1,294 patients were included in the final analysis (Figure 1).
The study was conducted in accordance with the principles of the Declaration of Helsinki and the Declaration of Istanbul, and the study protocol was approved by the Institutional Review Boards of the participating centers (4-2012-0223, 4-2014-0290). All participants provided informed consent.
Data Collection and Measurements
Socio-demographic characteristics including age, sex, and smoking history were collected during the pre-transplant screening period. General information about transplantation, including donor-recipient relationship, recipient information including comorbidities and medications, and donor information were collected at the time of KT. The resting office BP were conducted at each yearly visit. The eGFR was calculated using the Modification of Diet in Renal Disease equation [].
Exposure and Outcome Ascertainment
The main exposures in this study were baseline and time-varying SBP. We defined the baseline of this study as 1 year after KT. In the time-varying analysis, we used the most recent SBP at each visit. Patients were categorized into five groups based on SBP: <110 mmHg (group 1), 110–119 mmHg (group 2, reference), 120–129 mmHg (group 3), 130–139 mmHg (group 4) and ≥140 mmHg (group 5). We performed additional analysis using the SBP trajectory determined by the differences in SBP between the baseline (1 year after KT) and after 2 years and between the baseline and after 3 years.
The primary outcome was the composite kidney outcome of CKD progression or graft loss. CKD progression was defined as a ≥50% decline in eGFR from baseline values. Graft loss was defined as the requirement for maintenance dialysis for more than 3 months or re-transplantation. Patients were censored at the date of the last visit, all events or death.
Statistical Analysis
Continuous variables are expressed as mean values with standard deviation for normally distributed data or medians with interquartile ranges (IQRs) for skewed data. The Kolmogorov–Smirnov test was performed to determine the normality of all continuous variables. Categorical variables are presented as frequencies with percentage. Comparisons between groups were performed using a one-way analysis of variance or Kruskal–Wallis test for continuous variables, as appropriate. The chi-squared test or Fisher’s exact test was used for comparing categorical variables. Cox proportional hazards regression analysis evaluated the association between baseline SBP and study outcomes. In addition, we constructed marginal structural Cox models to reflect time-dependent changes in SBP and other covariates. In BP trajectory modeling, we used group-based trajectory modeling to categorize the trend of BP over time. The longitudinal BP was fitted as a mixture of multiple latent trajectories in a censored normal model with a polynomial function of time [, ]. Death events before the incidence of composite kidney outcome and loss to follow-up were treated by censoring at the date of death and the last examination, respectively. Significant variables related to CKD progression or graft loss in univariate analysis (p < 0.10) were included into all models for adjustment. Model 1 characterizes the crude hazard ratio (HR) without adjustment. Model 2 was adjusted for age, sex, body mass index (BMI), smoking status, diabetes mellitus (DM), CVD, eGFR, hemoglobin, albumin, low-density lipoprotein cholesterol (LDL-C), ABO compatibility, HLA compatibility, delayed graft function (DGF), acute rejection during the first year, donor type (living vs. deceased), donor age, donor BMI, donor hypertension, donor eGFR, and immunosuppressants (tacrolimus, cyclosporine, and steroids). Model 3 was further adjusted for BP-lowering medications (RAS blockers, beta-blockers, calcium channel blockers, alpha-blockers, and diuretics). In the trajectory model, baseline SBP was additionally adjusted. The results from multivariable hazard models are presented as HRs and 95% confidence intervals (CIs). All statistical analyses were performed with Stata 14 statistical software (StataCorp, College Station, TX), with a p-value <0.05 considered significant.
Results
Baseline Characteristics
Table 1 shows baseline characteristics of 808 participants according to baseline SBP categories. The mean age of participants was 45.8 ± 11.4 years, and 62.7% were women. Almost all patients (96.0%) had hypertension, and the mean SBP and DBP were 124.3 ± 12.6 and 78.7 ± 10.7 mmHg, respectively. The mean baseline eGFR was 64.7 ± 18.0 mL/min/1.73 m2. Numbers of patients with SBP <110, 110–119, 120–129, 130–140, and ≥140 mmHg were 93 (11.5%), 168 (20.8%), 292 (36.1%), 164 (20.3%), and 91 (11.3%), respectively. Patients with SBP ≥140 mmHg were older, more likely to be women, and had higher BMI. Moreover, those with highest SBP had more DM and treated with more RAS blockers, and beta-blockers than those with lower SBP groups.
TABLE 1
| SBP category (mmHg) | |||||||
|---|---|---|---|---|---|---|---|
| Total | <110 | 110–119 | 120–129 | 130–139 | ≥140 | p-value | |
| Demographic data | |||||||
| N (%) | 808 (100) | 93 (11.5) | 168 (20.8) | 292 (36.1) | 164 (20.3) | 91 (11.3) | |
| Age (years) | 45.8 ± 11.4 | 46.5 ± 10.6 | 44.5 ± 11.4 | 44.9 ± 11.7 | 46.8 ± 11.2 | 48.3 ± 10.7 | 0.034 |
| Female, n (%) | 507 (62.7) | 49 (52.7) | 99 (58.9) | 187 (64.0) | 105 (64.0) | 67 (73.6) | 0.040 |
| BMI (kg/m2) | 22.6 ± 3.2 | 21.7 ± 3.0 | 22.3 ± 2.9 | 22.8 ± 3.4 | 22.9 ± 3.3 | 23.5 ± 3.3 | 0.001 |
| SBP (mmHg) | 124.3 ± 12.6 | 103.2 ± 4.8 | 114.9 ± 2.9 | 124.1 ± 2.8 | 133.7 ± 2.8 | 146.7 ± 6.5 | <0.001 |
| DBP (mmHg) | 78.7 ± 10.7 | 66.3 ± 7.1 | 74.5 ± 7.3 | 78.5 ± 8.8 | 84.0 ± 8.3 | 89.7 ± 11.6 | <0.001 |
| Diabetes mellitus, n (%) | 207 (26.2) | 34 (37.0) | 28 (17.3) | 69 (24.3) | 38 (23.6) | 38 (41.8) | <0.001 |
| Hypertension, n (%) | 759 (96.1) | 86 (93.5) | 155 (95.7) | 271 (95.4) | 158 (98.1) | 89 (97.8) | 0.330 |
| Coronary artery disease, n (%) | 47 (5.9) | 4 (4.3) | 13 (8.0) | 15 (5.3) | 6 (3.7) | 9 (9.9) | 0.210 |
| Cerebrovascular disease, n (%) | 28 (3.5) | 7 (7.6) | 3 (1.9) | 13 (4.6) | 3 (1.9) | 2 (2.2) | 0.075 |
| Congestive heart failure, n (%) | 13 (1.6) | 1 (1.1) | 4 (2.5) | 5 (1.8) | 1 (0.6) | 2 (2.2) | 0.720 |
| Smoker, n (%) | 0.730 | ||||||
| Never | 434 (53.7) | 51 (54.8) | 90 (53.6) | 159 (54.5) | 88 (53.7) | 46 (50.5) | |
| Current | 52 (6.4) | 10 (10.8) | 11 (6.5) | 18 (6.2) | 7 (4.3) | 6 (6.6) | |
| Former | 322 (39.9) | 32 (34.4) | 67 (39.9) | 115 (39.4) | 69 (42.1) | 39 (42.9) | |
| Donor, n (%) | 0.920 | ||||||
| Living donor | 682 (84.4) | 80 (86.0) | 145 (86.3) | 244 (83.6) | 137 (83.5) | 76 (83.5) | |
| Deceased or DCD | 126 (15.6) | 13 (14.0) | 23 (13.7) | 48 (16.4) | 27 (16.5) | 15 (16.5) | |
| Donor age (years) | 45.2 ± 11.7 | 43.8 ± 12.5 | 43.6 ± 11.3 | 45.6 ± 11.5 | 45.8 ± 12.0 | 47.7 ± 11.6 | 0.052 |
| Donor BMI (kg/m2) | 23.8 ± 2.9 | 23.8 ± 2.7 | 23.6 ± 2.8 | 23.8 ± 3.1 | 23.7 ± 2.9 | 23.9 ± 2.8 | 0.920 |
| Donor hypertension, n (%) | 90 (37.3) | 4 (21.1) | 18 (35.3) | 36 (37.5) | 20 (41.7) | 12 (44.4) | 0.520 |
| ABO-incompatibility, n (%) | 147 (18.2) | 21 (22.6) | 29 (17.3) | 55 (18.8) | 21 (12.8) | 21 (23.1) | 0.200 |
| Delayed graft function, n (%) | 6 (0.7) | 0 (0.0) | 2 (1.2) | 2 (0.7) | 2 (1.2) | 0 (0.0) | 0.670 |
| Laboratory parameters | |||||||
| eGFR (ml/min/1.73 m2) | 64.7 ± 18.0 | 65.9 ± 17.9 | 66.5 ± 18.4 | 65.1 ± 18.4 | 62.4 ± 17.3 | 63.0 ± 16.6 | 0.220 |
| Donor eGFR (ml/min/1.73 m2) | 99.2 ± 40.9 | 99.1 ± 27.3 | 101.9 ± 29.9 | 99.0 ± 53.4 | 96.8 ± 36.9 | 99.5 ± 29.7 | 0.870 |
| Hemoglobin (g/dL) | 13.5 ± 1.9 | 13.3 ± 1.8 | 13.5 ± 2.0 | 13.5 ± 1.9 | 13.6 ± 1.9 | 13.9 ± 1.8 | 0.380 |
| Albumin (g/dL) | 4.4 ± 0.3 | 4.4 ± 0.3 | 4.3 ± 0.4 | 4.4 ± 0.3 | 4.4 ± 0.3 | 4.4 ± 0.3 | 0.260 |
| Fasting glucose (mg/dL) | 109.9 ± 37.0 | 109.0 ± 31.3 | 104.9 ± 30.2 | 111.4 ± 37.1 | 109.8 ± 42.6 | 115.2 ± 42.5 | 0.270 |
| T-Chol (mg/dL) | 178.0 ± 36.6 | 173.1 ± 41.5 | 174.0 ± 36.3 | 178.5 ± 35.4 | 182.4 ± 36.0 | 181.0 ± 36.5 | 0.150 |
| LDL-C (mg/dL) | 96.7 ± 30.6 | 96.2 ± 32.8 | 91.9 ± 31.0 | 97.9 ± 30.0 | 97.8 ± 29.6 | 100.2 ± 30.6 | 0.200 |
| HDL-C (mg/dL) | 58.4 ± 17.4 | 57.9 ± 17.3 | 59.3 ± 18.1 | 58.1 ± 16.3 | 59.7 ± 19.0 | 55.7 ± 16.2 | 0.450 |
| Triglyceride (mg/dL) | 136.7 ± 96.0 | 115.5 ± 45.0 | 128.3 ± 85.7 | 142.3 ± 114.9 | 143.5 ± 101.6 | 143.7 ± 69.6 | 0.088 |
| Drugs | |||||||
| Tacrolimus, n (%) | 755 (93.4) | 88 (94.6) | 155 (92.3) | 275 (94.2) | 154 (93.9) | 83 (91.2) | 0.800 |
| Cyclosporine, n (%) | 42 (5.2) | 5 (5.4) | 11 (6.5) | 12 (4.1) | 8 (4.9) | 6 (6.6) | 0.790 |
| Steroid, n (%) | 744 (92.1) | 86 (92.5) | 157 (93.5) | 263 (90.1) | 148 (90.2) | 90 (98.9) | 0.071 |
| RAS blockers, n (%) | 120 (14.9) | 6 (6.5) | 17 (10.1) | 50 (17.1) | 27 (16.5) | 20 (22.0) | 0.010 |
| Diuretics, n (%) | 50 (6.2) | 5 (5.4) | 10 (6.0) | 19 (6.5) | 8 (4.9) | 8 (8.8) | 0.790 |
| Beta-blockers, n (%) | 274 (33.9) | 22 (23.7) | 54 (32.1) | 94 (32.2) | 58 (35.4) | 46 (50.5) | 0.003 |
| Calcium channel blockers, n (%) | 379 (46.9) | 21 (22.6) | 76 (45.2) | 139 (47.6) | 92 (56.1) | 51 (56.0) | <0.001 |
| Alpha blockers, n (%) | 15 (1.9) | 2 (2.2) | 2 (1.2) | 5 (1.7) | 4 (2.4) | 2 (2.2) | 0.930 |
Baseline characteristics of participants according to systolic blood pressure categories.
Data are expressed as mean ± standard deviation, median [interquartile range], or proportion n (%).
Abbreviations: BMI, body mass index; SBP, systolic blood pressure; DBP, diastolic blood pressure; DCD, donation after circulatory death; eGFR, estimated glomerular filtration rate; T-Chol, total cholesterol; LDL-C, low-density lipoprotein cholesterol; HDL-C, high-density lipoprotein cholesterol; RAS blockers, renin-angiotensin system blockers.
Association of SBP With Adverse Kidney Outcomes
During a median follow-up period of 5.93 years, 85 (10.5%) participants reached the primary composite outcome and the overall incidence rate was 19.3 per 1,000 person-years (Table 2). The primary composite outcome of CKD progression or graft loss occurred in 15 (16.1%), 13 (7.7%), 29 (9.9%), 15 (9.1%), and 13 (14.3%) patients in groups 1 (SBP <110 mmHg), 2 (SBP 110–119 mmHg), 3 (SBP 120–129 mmHg), 4 (SBP 130–139 mmHg), and 5 (SBP ≥140 mmHg), respectively.
TABLE 2
| Outcomes | SBP categories (mmHg) | |||||
|---|---|---|---|---|---|---|
| Overall | <110 | 110–119 | 120–129 | 130–139 | ≥140 | |
| No. of participants, n (%) | 808 | 93 (11.5) | 168 (20.8) | 292 (36.1) | 164 (20.3) | 91 (11.3) |
| CKD progression | ||||||
| No. of person-years | 4386.9 | 497.1 | 906.0 | 1591.6 | 905.0 | 487.2 |
| Incidence of outcome, n (%) | 76 (9.4) | 13 (14.0) | 9 (5.4) | 26 (8.9) | 15 (9.1) | 13 (14.3) |
| Incidence rate per 1,000 person-year | 17.3 | 26.2 | 9.9 | 16.3 | 16.6 | 26.7 |
| Graft loss | ||||||
| No. of person-years | 5744.1 | 644.7 | 1188.2 | 2084.0 | 1191.1 | 636.1 |
| Incidence of outcome, n (%) | 36 (4.5) | 8 (8.6) | 6 (3.6) | 10 (3.4) | 7 (4.3) | 5 (5.5) |
| Incidence rate per 1,000 person-year | 6.3 | 12.4 | 5.0 | 4.8 | 5.9 | 7.9 |
| Kidney composite outcome | ||||||
| No. of person-years | 4400.3 | 495.8 | 910.4 | 1602.1 | 904.9 | 487.1 |
| Incidence of outcome, n (%) | 85 (10.5) | 15 (16.1) | 13 (7.7) | 29 (9.9) | 15 (9.1) | 13 (14.3) |
| Incidence rate per 1,000 person-year | 19.3 | 30.3 | 14.3 | 18.1 | 16.6 | 26.7 |
Abbreviations: CKD, chronic kidney disease; SBP, systolic blood pressure; eGFR, estimated glomerular filtration rate.
CKD progression was defined as a decline of ≥50% in eGFR.
Composite outcome was defined as CKD progression or graft loss.
When the cumulative incidence of the primary composite outcomes was compared between the baseline SBP groups using the log-rank test, group 2 (SBP 110–119 mmHg) showed a lower incidence than group 1 (SBP <110 mmHg, p = 0.041) and a trend of lower incidence than group 5 (SBP ≥140 mmHg, p = 0.085) (Figure 2A). In Cox regression analysis, the risk of CKD progression or graft loss increased in both group 1 and 5 compared with that in group 2. After adjustment for potential confounding factors, the adjusted HRs for groups 1 and 5 were 2.43 (95% confidence interval [CI], 1.12–5.26) and 2.25 (1.00–5.02), respectively, compared with the reference group 2 (Table 3).
FIGURE 2
TABLE 3
| Baseline SBP | Model 1 | Model 2 | Model 3 | |||
|---|---|---|---|---|---|---|
| HR (95% CI) | p-value | HR (95% CI) | p-value | HR (95% CI) | p-value | |
| <110 | 2.13 (1.01–4.48) | 0.046 | 2.31 (1.07–4.98) | 0.032 | 2.43 (1.12–5.26) | 0.024 |
| 110–119 | 1.00 | 1.00 | 1.00 | |||
| 120–129 | 1.26 (0.65–2.42) | 0.492 | 1.21 (0.62–2.35) | 0.579 | 1.22 (0.63–2.39) | 0.552 |
| 130–139 | 1.18 (0.56–2.47) | 0.670 | 1.26 (0.59–2.70) | 0.547 | 1.26 (0.59–2.70) | 0.550 |
| ≥140 | 1.91 (0.88–4.12) | 0.099 | 2.21 (0.99–4.94) | 0.053 | 2.25 (1.00–5.02) | 0.049 |
| Time-varying SBP | Model 1 | Model 2 | Model 3 | |||
|---|---|---|---|---|---|---|
| HR (95% CI) | p-value | HR (95% CI) | p-value | HR (95% CI) | p-value | |
| <110 | 2.14 (0.85–5.40) | 0.107 | 2.99 (1.10–8.09) | 0.031 | 3.02 (1.11–8.22) | 0.030 |
| 110–119 | 1.00 | 1.00 | 1.00 | |||
| 120–129 | 1.95 (0.91–4.16) | 0.085 | 2.30 (0.99–5.37) | 0.054 | 2.29 (0.98–5.35) | 0.055 |
| 130–139 | 1.68 (0.75–3.74) | 0.204 | 2.08 (0.85–5.12) | 0.109 | 2.06 (0.84–5.07) | 0.116 |
| ≥140 | 3.20 (1.48–6.89 | 0.003 | 3.67 (1.52–8.82) | 0.004 | 3.60 (1.48–8.72) | 0.005 |
The hazard ratios for the composite outcome of CKD progression or graft failure according to baseline SBP or time-varying SBP.
Model 1: Unadjusted. Model 2: Adjusted for age, sex, BMI, smoking status, DM, CVD, ABO compatibility, HLA compatibility, DGF, acute rejection during the first year, type of kidney donor (living or deceased donor), donor age, donor eGFR, donor BMI, donor hypertension, laboratory parameters (eGFR, hemoglobin, albumin, and LDL-C), and immunosuppressant use (tacrolimus, cyclosporine, and steroid). Model 3: Model 2 + BP-lowering drugs (RAS inhibitors, beta-blockers, calcium channel blockers, alpha-blockers, and diuretics).
Abbreviations: CKD, chronic kidney disease; SBP, systolic blood pressure; HR, hazard ratio; CI, confidence interval; BMI, body mass index; DM, diabetes mellitus; CVD, cardiovascular disease; HLA, human leukocyte antigen; DGF, delayed graft function; eGFR, estimated glomerular filtration rate; LDL-C, low-density lipoprotein cholesterol; RAS, inhibitors, renin-angiotensin system inhibitors.
Next, we examined the association of time-varying SBP levels with the composite kidney outcome using a marginal structural Cox regression model. In the fully adjusted model, group 1 and 5 had a 3.02 (95% CI 1.11–8.22) and 3.60 (95% CI, 1.48–8.72) -fold higher risk of composite outcomes than the reference group 2 (Table 3).
Association of SBP Trends With Adverse Kidney Outcomes
We further analyzed the association between SBP trends and adverse kidney outcomes. Incidence rates of composite kidney outcomes in the decreasing, stable, and increasing SBP trajectory groups were 11.2, 15.8, and 32.8 per 1,000 person-years, respectively (Table 4). The stable SBP group showed better outcomes than the increasing SBP group by log-rank test (p = 0.002, Figure 2B). In a fully adjusted Cox model, the HR for the increasing SBP trajectory group was 2.26 (95% CI, 1.34–3.81) compared with the stable SBP trajectory group (Table 5). The decreasing SBP trajectory group showed better outcomes than the stable SBP trajectory group (HR, 0.63; 95% CI 0.26–1.51, Table 5); however, the difference was not statistically significant.
TABLE 4
| Outcomes | SBP trajectory pattern | |||
|---|---|---|---|---|
| Overall | Decreasing | Stable | Increasing | |
| No. of participants n (%) | 748 (100.0) | 111 (14.8) | 471 (63.0) | 166 (22.2) |
| ≥50% decline in eGFRa | ||||
| No. of person-years | 4187.2 | 625.5 | 2653.2 | 908.5 |
| Incidence of outcome, n (%) | 72 (9.6) | 7 (6.3) | 37 (7.9) | 28 (16.9) |
| Incidence rate per 1,000 person-year | 17.2 | 11.2 | 13.9 | 30.8 |
| Graft loss | ||||
| No. of person-years | 4688.2 | 691.9 | 2972.7 | 1023.6 |
| Incidence of outcome, n (%) | 35 (4.7) | 0 (0.0) | 20 (4.2) | 15 (9.0) |
| Incidence rate per 1,000 person-year | 7.3 | 0 | 6.4 | 14.7 |
| Kidney composite outcomeb | ||||
| No. of person-years | 4196.0 | 625.5 | 2656.5 | 914.0 |
| Incidence of outcome, n (%) | 79 (10.5) | 7 (6.3) | 42 (8.9) | 30 (18.1) |
| Incidence rate per 1,000 person-year | 18.8 | 11.2 | 15.8 | 32.8 |
Outcome event rates according to SBP trajectory pattern.
Abbreviations: CKD, chronic kidney disease; SBP, systolic blood pressure; eGFR, estimated glomerular filtration rate.
CKD progression was defined as a decline of ≥50% in eGFR.
Composite outcome was defined as CKD progression or graft loss.
TABLE 5
| SBP trajectory | Model 1 | Model 2 | Model 3 | |||
|---|---|---|---|---|---|---|
| HR (95% CI) | p-value | HR (95% CI) | p-value | HR (95% CI) | p-value | |
| Decreasing | 0.72 (0.32–1.60) | 0.417 | 0.62 (0.26–1.49) | 0.287 | 0.63 (0.26–1.51) | 0.302 |
| Stable | 1.0 | 1.0 | 1.00 | |||
| Increasing | 2.06 (1.29–3.30) | 0.002 | 2.33 (1.38–3.92) | 0.002 | 2.26 (1.34–3.81) | 0.002 |
The hazard ratios for the composite outcome of CKD progression or graft failure according to SBP Trajectory Patterns.
Model 1: Unadjusted. Model 2: Adjusted for baseline SBP, age, sex, BMI, smoking status, DM, CVD, ABO compatibility, HLA compatibility, DGF, acute rejection during the first year, type of kidney donor (living or deceased donor), donor age, donor eGFR, donor BMI, donor hypertension, laboratory parameters (eGFR, hemoglobin, albumin, and LDL-C), and immunosuppressant use (tacrolimus, cyclosporine, and steroid). Model 3: Model 2 + BP-lowering drugs (RAS blockers, beta-blockers, calcium channel blockers, alpha-blockers, and diuretics).
Abbreviations: CKD, chronic kidney disease; SBP, systolic blood pressure; HR, hazard ratio; CI, confidence interval; BMI, body mass index; DM, diabetes mellitus; CVD, cardiovascular disease; HLA, human leukocyte antigen; DGF, delayed graft function; eGFR, estimated glomerular filtration rate; LDL-C, low-density lipoprotein cholesterol; RAS inhibitors, renin-angiotensin system inhibitors.
Association of SBP or SBP Trends With Adverse Kidney Outcomes in the Validation Cohort
Supplementary Table S1 shows the baseline characteristics of 1,294 participants according to baseline SBP categories. The mean age of participants was 47.8 ± 11.4 years, and 44.1% were women. The prevalence of hypertension was 75.2%, and the mean SBP and DBP were 125.4 ± 14.0 and 77.0 ± 11.0 mmHg, respectively. The mean baseline eGFR was 64.5 ± 18.3 mL/min/1.73 m2. The numbers of patients with SBP <110, 110–119, 120–129, 130–139, and ≥140 mmHg were 156 (12.1%), 241 (18.6%), 402 (31.1%), 308 (23.8%), and 17 (14.5%), respectively.
During a median follow-up period of 2.29 years, the overall incidence of the primary composite outcome was 17.2 per 1,000 person-years (Supplementary Table S2). The primary composite outcome occurred in 7 (4.5%), 6 (2.5%), 18 (4.5%), 13 (4.2%), and 14 (7.5%) patients in groups 1 (SBP <110 mmHg), 2 (SBP 110–119 mmHg), and 3 (SBP 120–129 mmHg), 4 (SBP 130–139 mmHg), and 5 (SBP ≥140 mmHg), respectively.
Although the risk of composite kidney outcome was high in group 5 (SBP ≥140 mmHg) than in group 2 (SBP 110–119 mmHg) of this validation cohort (HR, 3.85; 95% CI 1.42–10.43) in parallel with the discovery cohort, there was no statistically significant increase in risk in group 1 (SBP <110 mmHg) (Supplementary Table S3).
When the association of time-varying SBP levels with the composite kidney outcome was analyzed in the validation cohort, the group with group 5 had a 4.16-fold higher risk of composite kidney outcome than the reference group with group 2 similar to the discovery cohort (Supplementary Table S3).
When the cumulative incidence of the primary composite outcomes was compared between the SBP trajectory groups using multivariable Cox regression analysis, the trend was similar in the validation cohort as in the discovery cohort that the increasing SBP trajectory was associated with a higher risk of adverse kidney outcome compared with the stable SBP trajectory (HR, 2.75; 95% CI 1.10–6.84, Supplementary Table S4).
Discussion
In this study, we examined the association of baseline and time-varying SBP after kidney transplantation with composite kidney outcomes reflecting allograft function. Furthermore, we identified three patterns of SBP trends using trajectory modeling and evaluated the association between SBP trends and adverse kidney outcomes in KTRs. We found that baseline SBP at 1 year after transplantation higher than 140 mmHg was associated with a higher risk of adverse kidney outcomes of CKD progression or graft failure. Additionally, the risk of adverse kidney outcomes was 3.60-fold higher in patients with time-varying SBP ≥140 mmHg than in those with well-controlled SBP of 110–119 mmHg. In the BP trajectory model, the increasing BP trajectory was associated with a higher risk of composite kidney outcomes than those with a stable BP trajectory. Our findings suggest that chronically elevated BP after transplantation is associated with a declining kidney function in KTRs.
Hypertension is a well-established, major cause of cardiovascular events and a non-immunological factor of graft loss for KTRs [, –35]. However, no prospective RCTs have studied the association of optimal BP targets with clinically significant outcomes, including CVD, graft survival, and mortality. The latest 2021 KDIGO and 2017 ACC/AHA guidelines recommended a target of BP less than 130/80 mmHg in KTRs [, 36]. Current guidelines are mainly based on retrospective studies and registry data. The post hoc analysis of the FAVORIT trial showed that higher SBP is independently associated with an increased risk of CVD and all-cause mortality in KTRs []. The Collaborative Transplant Study registry examined the impact of post-transplant BP on long-term kidney graft outcomes in 29,751 deceased donor KTR []. This study concluded that increased BP is associated with functional graft loss. A US single-center study studied the relationship between blood pressure adjusted for renal function and allograft survival in 277 deceased donor KTR []. They showed that elevated SBP, DBP, and mean arterial BP at 1-year post-transplantation were significantly associated with allograft survival independent of baseline renal allograft function. Several prior studies for deceased donor KTRs, have examined the association of BP and allograft survival [, , 37]. For living donor KTRs, a US single center study with 392 KTRs reported that BP during the first year after transplantation is a significant factor of allograft failure independent of renal function [].
Our discovery cohort analysis suggested a U-shaped association of SBP at 1 year after KT with an increased risk of adverse kidney graft outcomes in Korean KTRs. The denervation status of kidney allografts and CNI may impair myogenic autoregulation, leading to a higher risk for acute kidney injury and more rapid loss of kidney function with low BP [38]. In parallel, a retrospective study also suggests controlling SBP within the range of 121–130 mmHg and implies that overly strict control of SBP below 120 mmHg might impair kidney allograft function [39]. However, our validation cohort analysis failed to confirm a significantly higher risk of low SBP, although it confirmed a higher risk of high SBP. Similarly, a conflicting result have been reported in previous studies. A post hoc analysis of the FAVORIT trial reported that low SBP <110 mmHg was not associated with a higher risk for eGFR decline or allograft failure in KTRs with no evidence of a “U” shaped relationship [38]. Although high SBP is universally acknowledged as a risk factor [, , , , 40], the optimal range of SBP to maximize graft and patient survival remains a topic of ongoing research.
In time-varying analysis and trajectory models, we showed that chronically high SBP and persistently increasing SBP have adverse effects on allograft function. Despite ongoing debate regarding the optimal SBP target, our findings underscore the critical importance of not only achieving optimal BP levels but also implementing regular monitoring and management of BP in KTRs. These results emphasize the necessity for healthcare providers to closely track and adjust treatment plans in response to fluctuations in blood pressure.
This study had several strengths, although many findings are consistent with those of prior seminal studies. First, while previous studies mainly studied the association between baseline BP at spot time and graft failure, our study investigated the association between time-varying SBP and graft outcomes. Since a time-varying analysis was performed, it was possible to reflect BP fluctuation over time, and the effect of long-term BP after transplantation on graft outcomes could be evaluated. Moreover, this study examined the temporal association of various BP trends with the risk of graft outcomes by trajectory modeling. Second, this was an intermediate-sized, multicenter transplant study with complete follow-up data collected prospectively over several years. Furthermore, we implemented the same analysis using a validated cohort of large, nationwide population to support our main findings. Third, we included recipients who received kidney grafts from living and deceased donors to reflect real-world situations and adjusted covariates related to KT-specific factors, such as donor characteristics, DGF, and compatibility of donors and recipients to minimize the influence of transplant-related factors that could affect kidney graft function. Fourth, as the first Asian data, this study can contribute to generalization of the previous results derived from the Western countries.
This study had several limitations. First, owing to the observational design of this study, our results cannot prove causality between SBP and adverse kidney outcomes, and all potential confounding factors could not be completely controlled. However, this study consisted of a large and homogeneous population, and multiple potential confounding factors were included in the adjustment model. Second, the SBP used as the baseline was based on a single measurement. To overcome this limitation, we employed time-varying and trajectory statistical method, further supporting our primary study results. Third, there was a discrepancy between the study results using the discovery and validation cohort. In the discovery cohort, although not statistically significant, the risk of adverse kidney outcomes tended to increase in the group with time-varying SBP less than 110 mmHg, whereas it seemed to decrease in the validation cohort. There were several differences between the two cohorts. Comparing the baseline characteristics of participants in the two cohorts, deceased donor KT occupied a larger proportion in the validation cohort than in the discovery cohort. The medication use could not be adjusted in the regression model since there was no information on medications, including immunosuppressants and BP-lowering medications, in the validation cohort. In addition, the validation cohort had a shorter median follow-up period than the discovery cohort. Further, large-scale, randomized, controlled trials with longer follow-up periods are needed to confirm the present results for the optimal BP target and the impact of BP on kidney allograft outcomes in KTRs.
In conclusion, high SBP (≥140 mmHg) at 1 year after KT was associated with an increased risk of CKD progression or graft failure in KTRs. A higher time-varying SBP (≥140 mmHg) and an increasing trend of SBP were also associated with an increased risk of adverse kidney allograft outcomes.
Statements
Data availability statement
The raw data supporting the conclusions of this article will be made available by the authors, without undue reservation.
Ethics statement
The studies involving humans were approved by the Institutional Review Boards of Severance Hospital, Yonsei University (4-2012-0223, 4-2014-0290). The studies were conducted in accordance with the local legislation and institutional requirements. The participants provided their written informed consent to participate in this study. Written informed consent was obtained from the individual(s) for the publication of any potentially identifiable images or data included in this article.
Author contributions
Research idea and study design: JY; data acquisition: HJK, KWK, JR, H-YJ, KHJ, M-GK, MJ, SH, JL, KPK, HR, KL, KH, and MKJ; data analysis/interpretation: HJK, KWK, YSJ, BSK, and JY; statistical analysis: HJK, KWK, and YSJ; supervision or mentorship: BSK and JY. All authors contributed to the article and approved the submitted version.
Funding
The authors declare that financial support was received for the research, authorship, and/or publication of this article. This work was supported by Research Programs funded by the Korea Disease Control and Prevention Agency (2011E3300300, 2012E3301100, 2013E3301600, 2013E3301601, 2013E3301602, 2016E3300200, 2016E3300201, 2016E3300202, 2019E320100, 2019E320101, 2019E320102, 2022-11-007; 2014-ER6301-00, 2014-ER6301-01, 2014-ER6301-02, 2017-ER6301-00, 2017-ER6301-01, 2017-ER6301-02, 2020-ER7201-00, 2020-ER7201-01, 2020-ER7201-02, 2023-ER0805-00).
Acknowledgments
We thank all the study investigators and coordinators who participated in the KNOW-KT and KOTRY study.
Conflict of interest
The authors declare that the research was conducted in the absence of any commercial or financial relationships that could be construed as a potential conflict of interest.
Supplementary material
The Supplementary Material for this article can be found online at: https://www.frontierspartnerships.org/articles/10.3389/ti.2024.12574/full#supplementary-material
References
1.
CampistolJMRomeroRPaulJGutiérrez-DalmauA. Epidemiology of Arterial Hypertension in Renal Transplant Patients: Changes Over the Last Decade. Nephrol Dial Transpl (2004) 19(Suppl. 3):iii62–6. PMID: 15192139. 10.1093/ndt/gfh1018
2.
KasiskeBLAnjumSShahRSkogenJKandaswamyCDanielsonBet alHypertension After Kidney Transplantation. Am J Kidney Dis (2004) 43:1071–81. PMID: 15168388. 10.1053/j.ajkd.2004.03.013
3.
CurtisJJ. Cyclosporine and Posttransplant Hypertension. J Am Soc Nephrol (1992) 2:S243–5. 10.1681/ASN.V212s243
4.
TalerSJTextorSCCanzanelloVJSchwartzL. Cyclosporin-Induced Hypertension: Incidence, Pathogenesis and Management. Drug Saf (1999) 20:437–49. 10.2165/00002018-199920050-00004
5.
PirpirisMSudhirKYeungSJenningsGWhitworthJA. Pressor Responsiveness in Corticosteroid-Induced Hypertension in Humans. Hypertension (1992) 19:567–74. 10.1161/01.hyp.19.6.567
6.
ChanWBoschJAJonesDMcTernanPGInstonNMooreSet alHypervolemia and Blood Pressure in Prevalent Kidney Transplant Recipients. Transplantation (2014) 98:320–7. 10.1097/TP.0000000000000066
7.
TantisattamoEMolnarMZHoBTReddyUGDafoeDCIchiiHet alApproach and Management of Hypertension After Kidney Transplantation. Front Med (Lausanne) (2020) 7:229. 10.3389/fmed.2020.00229
8.
GoodwinJEZhangJGellerDS. A Critical Role for Vascular Smooth Muscle in Acute Glucocorticoid-Induced Hypertension. J Am Soc Nephrol (2008) 19:1291–9. 10.1681/ASN.2007080911
9.
VeenstraDLBestJHHornbergerJSullivanSDHricikDE. Incidence and Long-Term Cost of Steroid-Related Side Effects After Renal Transplantation. Am J Kidney Dis (1999) 33:829–39. 10.1016/s0272-6386(99)70414-2
10.
HoornEJWalshSBMcCormickJAZietseRUnwinRJEllisonDH. Pathogenesis of Calcineurin Inhibitor-Induced Hypertension. J Nephrol (2012) 25:269–75. 10.5301/jn.5000174
11.
MurrayBMPallerMSFerrisTF. Effect of Cyclosporine Administration on Renal Hemodynamics in Conscious Rats. Kidney Int (1985) 28:767–74. 10.1038/ki.1985.196
12.
MarumoTNakakiTHishikawaKSuzukiHKatoRSarutaT. Cyclosporin A Inhibits Nitric Oxide Synthase Induction in Vascular Smooth Muscle Cells. Hypertension (1995) 25:764–8. 10.1161/01.hyp.25.4.764
13.
MossNGPowellSLFalkRJ. Intravenous Cyclosporine Activates Afferent and Efferent Renal Nerves and Causes Sodium Retention in Innervated Kidneys in Rats. Proc Natl Acad Sci U S A (1985) 82:8222–6. 10.1073/pnas.82.23.8222
14.
BartholomeuszBHardyKJNelsonASPhillipsPA. Modulation of Nitric Oxide Improves Cyclosporin A-Induced Hypertension in Rats and Primates. J Hum Hypertens (1998) 12:839–44. 10.1038/sj.jhh.1000709
15.
KasiskeBL. Ischemic Heart Disease After Renal Transplantation. Kidney Int (2002) 61:356–69. 10.1046/j.1523-1755.2002.00121.x
16.
RigattoCParfreyPFoleyRNegrijnCTribulaCJefferyJ. Congestive Heart Failure in Renal Transplant Recipients: Risk Factors, Outcomes, and Relationship With Ischemic Heart Disease. J Am Soc Nephrol (2002) 13:1084–90. 10.1681/ASN.V1341084
17.
KendrickE. Cardiovascular Disease and the Renal Transplant Recipient. Am J Kidney Dis (2001) 38:S36–43. 10.1053/ajkd.2001.28924
18.
CarpenterMAJohnAWeirMRSmithSRHunsickerLKasiskeBLet alBP, Cardiovascular Disease, and Death in the Folic Acid for Vascular Outcome Reduction in Transplantation Trial. J Am Soc Nephrol (2014) 25:1554–62. 10.1681/ASN.2013040435
19.
BrennerBMHumesHD. Mechanics of Glomerular Ultrafiltration. N Engl J Med (1977) 297:148–54. 10.1056/NEJM197707212970308
20.
RaijLAzarSKeaneWF. Role of Hypertension in Progressive Glomerular Immune Injury. Hypertension (1985) 7:398–404. 10.1161/01.hyp.7.3_pt_1.398
21.
MangeKCCizmanBJoffeMFeldmanHI. Arterial Hypertension and Renal Allograft Survival. JAMA (2000) 283:633–8. 10.1001/jama.283.5.633
22.
MangeKCFeldmanHIJoffeMMFaKBloomRD. Blood Pressure and the Survival of Renal Allografts From Living Donors. J Am Soc Nephrol (2004) 15:187–93. 10.1097/01.asn.0000104574.04006.08
23.
SPRINT Research Group, WrightJTJrWilliamsonJDWheltonPKSnyderJKSinkKMRoccoMVet alA Randomized Trial of Intensive Versus Standard Blood-Pressure Control. N Engl J Med (2015) 373:2103–16. 10.1056/NEJMoa1511939
24.
CheungAKRahmanMReboussinDMCravenTEGreeneTKimmelPLet alEffects of Intensive BP Control in CKD. J Am Soc Nephrol (2017) 28:2812–23. 10.1681/ASN.2017020148
25.
ACCORD Study Group, CushmanWCEvansGWByingtonRPGoffDCJrGrimmRHJrCutlerJAet alEffects of Intensive Blood-Pressure Control in Type 2 Diabetes Mellitus. N Engl J Med (2010) 362:1575–85. 10.1056/NEJMoa1001286
26.
Kidney Disease: Improving Global Outcomes (KDIGO) Blood Pressure Work Group. KDIGO 2021 Clinical Practice Guideline for the Management of Blood Pressure in Chronic Kidney Disease. Kidney Int (2021) 99:S1–S87. 10.1016/j.kint.2020.11.003
27.
YangJLeeJHuhKHParkJBChoJHLeeSet alKNOW-KT (Korean Cohort Study for Outcome in Patients With Kidney Transplantation: A 9-Year Longitudinal Cohort Study): Study Rationale and Methodology. BMC Nephrol (2014) 15:77. 10.1186/1471-2369-15-77
28.
JeonHJKooTYJuMKChaeDWChoiSJNKimMSet alThe Korean Organ Transplantation Registry (KOTRY): An Overview and Summary of the Kidney-Transplant Cohort. Kidney Res Clin Pract (2022) 41:492–507. 10.23876/j.krcp.21.185
29.
LeveyASStevensLASchmidCHZhangYLCastroAFFeldmanHIet alA New Equation to Estimate Glomerular Filtration Rate. Ann Intern Med (2009) 150:604–12. 10.7326/0003-4819-150-9-200905050-00006
30.
NaginDSOdgersCL. Group-Based Trajectory Modeling in Clinical Research. Annu Rev Clin Psychol (2010) 6:109–38. 10.1146/annurev.clinpsy.121208.131413
31.
NaginDSJonesBLPassosVLTremblayRE. Group-Based Multi-Trajectory Modeling. Stat Methods Med Res (2018) 27:2015–23. 10.1177/0962280216673085
32.
OpelzGWujciakTRitzE. Association of Chronic Kidney Graft Failure With Recipient Blood Pressure. Collaborative Transplant Study. Kidney Int (1998) 53:217–22. 10.1046/j.1523-1755.1998.00744.x
33.
CheighJSHaschemeyerRHWangJCRiggioRRTapiaLStenzelKHet alHypertension in Kidney Transplant Recipients. Effect on Long-Term Renal Allograft Survival. Am J Hypertens (1989) 2:341–8. 10.1093/ajh/2.5.341
34.
WeirMRBurgessEDCooperJEFenvesAZGoldsmithDMcKayDet alAssessment and Management of Hypertension in Transplant Patients. J Am Soc Nephrol (2015) 26:1248–60. 10.1681/ASN.2014080834
35.
HernándezD. Left Ventricular Hypertrophy After Renal Transplantation: New Approach to a Deadly Disorder. Nephrol Dial Transpl (2004) 19:1682–6. 10.1093/ndt/gfh283
36.
WheltonPKCareyRMAronowWSCaseyDEJrCollinsKJDennison HimmelfarbCet al2017 ACC/AHA/AAPA/ABC/ACPM/AGS/APhA/ASH/ASPC/NMA/PCNA Guideline for the Prevention, Detection, Evaluation, and Management of High Blood Pressure in Adults: Executive Summary: A Report of the American College of Cardiology/American Heart Association Task Force on Clinical Practice Guidelines. Hypertension (2018) 71:1269–324. 10.1161/HYP.0000000000000066
37.
CosioFGDillonJJFalkenhainMETesiRJHenryMLElkhammasEAet alRacial Differences in Renal Allograft Survival: The Role of Systemic Hypertension. Kidney Int (1995) 47:1136–41. 10.1038/ki.1995.162
38.
MalhotraRKatzRWeinerDELeveyASCheungAKBostomAGet alBlood Pressure, Chronic Kidney Disease Progression, and Kidney Allograft Failure in Kidney Transplant Recipients: A Secondary Analysis of the FAVORIT Trial. Am J Hypertens (2019) 32:816–23. 10.1093/ajh/hpz095
39.
AgarwalKAAgarwalUKPavlakisM. Impact of Blood Pressure Control on Graft Survival in Kidney Transplant Recipients. Transpl Proc (2023) 55:98–102. 10.1016/j.transproceed.2022.12.010
40.
PagonasNBauerFSeibertFSSeidelMSchenkerPKykalosSet alIntensive Blood Pressure Control Is Associated With Improved Patient and Graft Survival After Renal Transplantation. Sci Rep (2019) 9:10507. 10.1038/s41598-019-46991-2
Summary
Keywords
kidney transplantation, graft outcome, blood pressure, time-varying, trajectory
Citation
Kim HJ, Kim KW, Joo YS, Ryu J, Jung H-Y, Jeong KH, Kim M-G, Ju MK, Han S, Lee JS, Kang KP, Ro H, Lee KW, Huh KH, Kim MS, Kim BS and Yang J (2024) Impact of Blood Pressure on Allograft Function and Survival in Kidney Transplant Recipients. Transpl Int 37:12574. doi: 10.3389/ti.2024.12574
Received
16 December 2023
Accepted
22 July 2024
Published
07 August 2024
Volume
37 - 2024
Updates
Copyright
© 2024 Kim, Kim, Joo, Ryu, Jung, Jeong, Kim, Ju, Han, Lee, Kang, Ro, Lee, Huh, Kim, Kim and Yang.
This is an open-access article distributed under the terms of the Creative Commons Attribution License (CC BY). The use, distribution or reproduction in other forums is permitted, provided the original author(s) and the copyright owner(s) are credited and that the original publication in this journal is cited, in accordance with accepted academic practice. No use, distribution or reproduction is permitted which does not comply with these terms.
*Correspondence: Jaeseok Yang, jcyjs@yuhs.ac
‡ These authors have contributed equally to this work
ORCID: Jaeseok Yang, orcid.org/0000-0002-5378-7797
§The full list of KOTRY study group was described in the Supplementary Material
Disclaimer
All claims expressed in this article are solely those of the authors and do not necessarily represent those of their affiliated organizations, or those of the publisher, the editors and the reviewers. Any product that may be evaluated in this article or claim that may be made by its manufacturer is not guaranteed or endorsed by the publisher.