Abstract
Introduction::
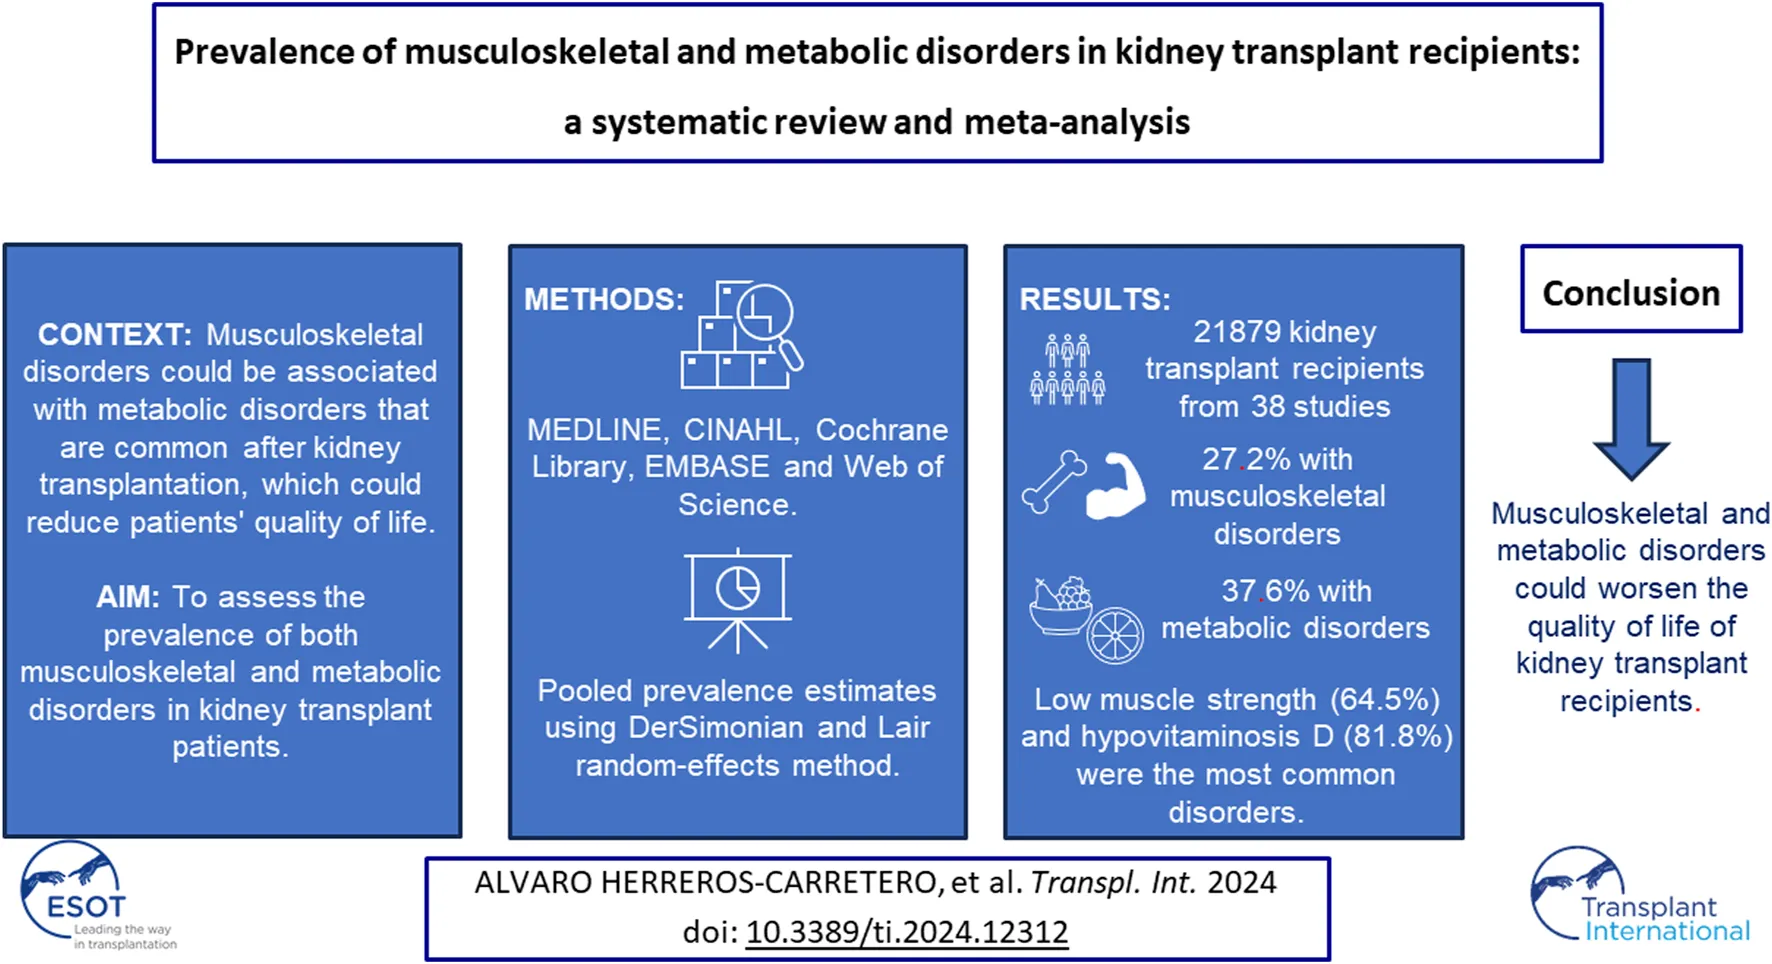
Musculoskeletal disorders could be associated with metabolic disorders that are common after kidney transplantation, which could reduce the quality of life of patients. The aim of this study was to assess the prevalence of both musculoskeletal and metabolic disorders in kidney transplant patients.
Methods::
MEDLINE, CINAHL, Cochrane Library, EMBASE and Web of Science were searched from their inception up to June 2023. DerSimonian and Laird random-effects method was used to calculate pooled prevalence estimates and their 95% confidence intervals (CIs).
Results::
21,879 kidney transplant recipients from 38 studies were analysed. The overall proportion of kidney transplant patients with musculoskeletal disorders was 27.2% (95% CI: 18.4–36.0), with low muscle strength (64.5%; 95% CI: 43.1–81.3) being the most common disorder. Otherwise, the overall proportion of kidney transplant patients with metabolic disorders was 37.6% (95% CI: 21.9–53.2), with hypovitaminosis D (81.8%; 95% CI: 67.2–90.8) being the most prevalent disorder.
Conclusion::
The most common musculoskeletal disorders were low muscle strength, femoral osteopenia, and low muscle mass. Hypovitaminosis D, hyperparathyroidism, and hyperuricemia were also the most common metabolic disorders. These disorders could be associated with poorer quality of life in kidney transplant recipients.
Systematic Review Registration::
https://www.crd.york.ac.uk/prospero/, identifier [CRD42023449171].
Introduction
Renal transplantation represents the best therapy for patients diagnosed with end-stage renal disease. Major advances in surgical techniques and immunosuppressive treatment have led to a substantial improvement in the survival of these patients over the last few decades, resulting in a higher quality of life and lower treatment-related costs compared to dialysis [, ]. This surgical procedure involves the replacement of a healthy kidney, either from a living or deceased donor, in a patient whose kidneys are not functioning properly []. According to the Global Observatory on Donation and Transplantation (GODT3), a total of 65,668 kidney transplants were performed worldwide in 2021, making the kidney commonly the most transplanted organ [].
Despite the improvement in the patient’s clinical status compared to the patient’s previous disease status, this therapy does not imply a cure []. The evolution of kidney transplant recipients will depend fundamentally on the use of immunosuppressive drugs, the origin of the transplanted kidney, the characteristics of the patient and several events that may occur in the post-transplant period [], which pose certain risks to the health and quality of life of the transplant recipient. These post-transplant events include renal, infectious, urological, surgical, cardiovascular, and cerebrovascular complications, side effects of the drugs used to prevent rejection, and metabolic disorders [].
In relation to the above, there are several metabolic disorders, such as hypercalcemia, hypophosphatemia, hyperparathyroidism, and hypovitaminosis D, among others, which are common in these patients and have the potential to cause loss of bone mineral density (BMD), as occurs with the use of glucocorticoids, whose doses are higher immediately after transplantation [, , ]. This loss of BMD leads to several musculoskeletal disorders that can affect the quality of life of transplant patients and need to be controlled.
Musculoskeletal disorders include a group of pathologies suffered by many patients after surgery, the exact prevalence of which is not yet well known []. This group includes disorders such as osteopenia, osteoporosis, and sarcopenia, which involve both a reduction in bone density and a reduction in strength and muscle mass, respectively []. Although it is a common complication in these patients, involving the loss of bone and muscle mass, especially in the first months after transplantation, both diagnosis and treatment to prevent these pathologies are still inadequate [, ]. Furthermore, there is a lack of studies that accurately synthesize and estimate the proportion of musculoskeletal and metabolic disorders in renal transplant patients. Therefore, the aim of this study was to carry out a systematic review and meta-analysis to determine the prevalence of musculoskeletal disorders and their related metabolic disorders in kidney transplant patients.
Methods
This systematic review adhered to the Cochrane Collaboration Handbook, the Meta-analyses of Observational Studies in Epidemiology (MOOSE) guidelines, and the “Preferred Reporting Items for Systematic Reviews and Meta-Analysis” (PRISMA) guidelines []. This study was registered in the International Prospective Register of Systematic Reviews (PROSPERO) with the registration number (CRD42023449171).
Search Strategy
A systematic search in MEDLINE (via PubMed), CINAHL, Cochrane Library, EMBASE (via Scopus), and Web of Science (WOS) was conducted from inception to June 2023. Gray literature and the references of selected studies were also reviewed to identify additional studies. The search strategy combined the following terms using Boolean operators: “post-kidney transplant,” “post-renal transplant,” “kidney transplant,” “renal transplant,” “musculoskeletal,” “muscular pain,” “muscle pain,” sarcopenia, fibromyalgia, myopathy, “joint pain,” fracture, fragility, “bone pain syndrome,” “bone syndrome,” “bone pain,” “bone disease,” “bone disorder,” “lower limb pain,” hyperparathyroidism, hypophosphatemia, gout, hyperuricemia, arthritis, “bone loss,” osteoporosis, osteopenia, osteomalacia, “mineral disorder,” hypercalcemia, “vitamin D,” “hypovitaminosis D,” “vitamin D deficiency.” The references of the included studies were also checked. If the full text of a study was not available, the authors of the study were contacted. The systematic search was conducted independently by two investigators (AH-C and MG-M). The detailed search strategy is available in Supplementary Table S1.
Eligibility Criteria
Observational studies analysing musculoskeletal and metabolic disorders developed in kidney transplant patients were included. The inclusion criteria were as follows: 1) population: adult patients over 18 years of age; 2) study design: cross-sectional or baseline data from longitudinal studies without language restriction; and 3) outcome: primary outcomes including prevalence of musculoskeletal or metabolic disorders in kidney transplant recipients. Exclusion criteria were as follows: 1) ineligible publication types (clinical trials, literature reviews, commentaries, or letters to the editor); 2) patients with other previous nonrenal transplants; 3) pregnant or breastfeeding women; and 4) no access to full text.
Data Extraction
After selecting the studies that met the inclusion criteria, the following data were collected and described in a descriptive table (Table 1): (a) first author and year of publication; (b) country; (c) study design; and (d) sample characteristics (year of transplantation, number of participants, age, and sex); and (e) outcome analysed. If more than one study provided data on the same sample, the study with the most detailed results and/or with the largest sample size was selected for data synthesis.
TABLE 1
| Author and year | Country | Study design | Sample characteristics | Outcome (prevalence) | ||||
|---|---|---|---|---|---|---|---|---|
| Transplant year | n | Age and gender (% women) | Time since transplant | Time on haemodialysis prior to transplant | ||||
| Alagoz S. et al. [] 2019 | Turkey | Retrospective longitudinal | 2002–2012 | 176 | 32.9 ± 11.8 (38.1) | 1 month | 33.8 ± 33.1 months | Hypercalcemia (18.2%) Hypophosphatemia (33.3%) Hyperparathyroidism (45.3%) |
| 12 months | Hypercalcemia (17.2%) Hypophosphatemia (8.6%) Hyperparathyroidism (29.4%) | |||||||
| 60 months | Hypercalcemia (13.2%) Hypophosphatemia (11.4%) Hyperparathyroidism (9.2%) | |||||||
| Amin T. et al. [] 2016 | Australia | Cross-sectional | 1971–2011 | 679 | 55 ± 13 (39) | ≥3 months | 28.8 ± 24 months | Hypercalcemia (15%) |
| Batteux B. et al. [] 2020 | France | Prospective longitudinal | 2012–2018 | 310 | 51.1 ± 12.8 (37.4) | 1 month | 30 months | Osteopenia: lumbar area (34.5%); femoral area (53.5%) |
| Osteoporosis: lumbar area (6.1%); femoral area (10%) | ||||||||
| Berga JK. Et al []. 2010 | Spain | Retrospective longitudinal | — | 110 | 50.2 ± 11 (53) | — | — | Hypovitaminosis D (96.4%): insufficiency (43.6%), deficiency (52.7%) |
| Braga Jr JWR. et al. [] 2006 | Brazil | Cross-sectional | 2000 | 191 | 44.8 ± 0.8 (50.8) | 87 ± 3.7 months | 46.48 ± 3.03 months | Osteopenia: lumbar area (32.5%); femoral area (33%) |
| Osteoporosis: lumbar area (11.5%); femoral area (11%) | ||||||||
| Fractures (24.1%) | ||||||||
| Chan W. et al. [] 2019 | United Kingdom | Prospective longitudinal | 2010–2013 | 128 | 49 ± 15 (44) | 60 (12–132) months | — | Sarcopenia (28.9%) |
| Low muscle strength (64.1%) | ||||||||
| Low muscle mass (35.9%) | ||||||||
| Conley E. et al. [] 2008 | United States | Retrospective longitudinal | 1998–2006 | 554 | 46.3 ± 0.5 (42.2) | 14 months | — | Fractures (13%) |
| Einollahi E. et al. [] 2013 | Iran | Cross-sectional | 2008–2011 | 4,217 | 38 ± 15 (36) | 60 months | — | Hyperuricemia (31.8%) |
| Evenepoel P. et al. [] 2019 | Belgium | Cross-sectional | 2006–2013 | 518 | 54.7 ± 12.8 (39.4) | >2 weeks | — | Hypovitaminosis (38.4%): insufficiency (35.1%); deficiency (3.3%) |
| Osteopenia: lumbar area (8.1%); femoral area (55%) | ||||||||
| Osteoporosis: lumbar area (23.7%); femoral area (22%) | ||||||||
| Fractures (7.3%) | ||||||||
| Férnandez Castillo R. et al. [] 2018 | Spain | Cross-sectional | — | 119 | −(41.2) | 6 months | — | Osteopenia: lumbar area (32.9%); femoral area (49.3%) |
| Osteoporosis: lumbar area (30.1%); femoral area (15.1%) | ||||||||
| 12 months | Osteopenia: lumbar area (38.4%); femoral area (51.5%) | |||||||
| Osteoporosis: lumbar area (30.8%); femoral area (16.7%) | ||||||||
| Gregorini M. et al. [] 2017 | Italy | Cross-sectional | 2000–2016 | 297 | 55.5 ± 12 (34.7) | 24 months | — | Osteopenia: lumbar area (40.4%); femoral area (50.2%) |
| Osteoporosis: lumbar area (13.8%); femoral area (20.9%) | ||||||||
| Fractures (12.1%) | ||||||||
| Hamidian Jahromi A. et al. [] 2009 | England | Prospective longitudinal | 2000–2002 | 121 | 35.5 ± 12.5 (30.6) | 3 months | 17.4 ± 6 months | Hypercalcemia (17.4%) |
| Hyperparathyroidism (9.9%) | ||||||||
| 12 months | Hypercalcemia (5.7%) | |||||||
| Hyperparathyroidism (5.7%) | ||||||||
| Jerman A. et al. [] 2017 | Slovenia | Cross-sectional | 1976–2011 | 507 | 54.3 ± 12 (45) | 116.4 months | 63.4 ± 43.6 months | Fractures (12.6%) |
| Jørgensen HS. et al. [] 2016 | Norway | Cross-sectional | 2006–2011 | 701 | 52.2 ± 14.7 (32.4) | 2.5 months | 13.8 (7.8–26.3) months | Osteopenia: lumbar area (35.7%); femoral area (51.8%) |
| Osteoporosis: lumbar area (16.8%); femoral area (26%) | ||||||||
| Khosravi M. et al. [] 2020 | Iran | Cross-sectional | — | 148 | 43.8 ± 12.7 (48) | 67.59 ± 42.66 months | 14.18 ± 16.05 months | Osteopenia: lumbar area (49.3%) |
| Osteoporosis: lumbar area (18.9%) | ||||||||
| Kim KM. et al. [] 2010 | South Korea | Cross-sectional | 1990–2008 | 356 | 39.3 ± 10.3 (39.3) | 102.63 ± 27.25 months | — | Hyperuricemia (15.4%) |
| Kosoku A. et al. [] 2020 | Japan | Cross-sectional | — | 210 | 55 ± 10 (42) | 85 (43–135) months | 19 (6–67) months | Sarcopenia (11%) |
| Limirio LS. et al. [] 2019 | Brazil | Cross-sectional | — | 127 | 47.6 ± 11.5 (31.5) | 95.5 ± 78.2 months | 55.4 ± 43.5 months | Sarcopenia (50.4%) |
| Low muscle strength (80.3%) | ||||||||
| Low muscle mass (61.4%) | ||||||||
| López Ruiz ML. et al. [] 2015 | Spain | Cross-sectional | 2002–2009 | 306 | 46.9 ± 13.8 (37.6) | 12 months | — | Osteopenia: lumbar area (14.4%); femoral area (19.6%) |
| Osteoporosis: lumbar area (12.4%); femoral area (6.9%) | ||||||||
| Malheiro J. et al. [] 2012 | Portugal | Cross-sectional | 1983–2010 | 302 | 49.6 ± 13.4 (39.4) | 91.2 (27.6–170.4) months | — | Hyperuricemia (42.1%) |
| Marcén R. et al. [] 2009 | Spain | Cross-sectional | — | 509 | 45.4 ± 14.5 (42) | 113 ± 76 months | — | Hypovitaminosis D (85.3%): insufficiency (47%); deficiency (38.3%) |
| Menna Barreto APM. et al. [] 2019 | Brazil | Cross-sectional | — | 185 | 50 ± 7 (43) | 117 (32–173) months | — | Sarcopenia (17.3%) |
| Low muscle strength (45.9%) | ||||||||
| Low muscle mass (23.8%) | ||||||||
| Muirhead N. et al. [] 2014 | Canada | Retrospective longitudinal | 2003–2008 | 1,000 | 50 ± 12.5 (35.6) | 12 months | — | Hypercalcemia (16.6%) |
| Hyperparathyroidism (47.6%) | ||||||||
| 24 months | Hypercalcemia (13.6%) | |||||||
| Hyperparathyroidism (51.1%) | ||||||||
| 36 months | Hypercalcemia (9.5%) | |||||||
| Hyperparathyroidism (43.4%) | ||||||||
| 48 months | Hypercalcemia (10.1%) | |||||||
| Hyperparathyroidism (39.3%) | ||||||||
| Ozkayar N. et al. [34] 2014 | Turkey | Cross-sectional | — | 166 | 37.9 ± 11.9 (41) | — | — | Sarcopenia (20.5%) |
| Park WY. et al. [35] 2017 | United Kingdom | Prospective longitudinal | 2011–2013 | 207 | 45 ± 11 (46.4) | 12 months | 25.3 months | Osteopenia: femoral area (40.1%) |
| Osteoporosis: femoral area (47.3%) | ||||||||
| Patel S. et al. [36] 2001 | United Kingdom | Cross-sectional | 1998 | 165 | 46 ± (42) | 61.2 months | 18 months | Osteopenia: lumbar area (30.9%); femoral area (40.6%) |
| Osteoporosis: lumbar area (7.9%); femoral area (10.3%) | ||||||||
| Fractures (16.4%) | ||||||||
| Savaj S. et al. [37] 2012 | Iran | Cross-sectional | 2010 | 113 | 46.1 ± 13.6 (51.3) | 106.4 ± 77.0 months | 147.1 ± 92.8 months | Hyperparathyroidism (76.1%) |
| Hypovitaminosis D (94.7%): insufficiency (49.6%). deficiency (45.1%) | ||||||||
| Osteopenia: lumbar area (52.2%); femoral area (36.3%) | ||||||||
| Osteoporosis: lumbar area (12.4%); femoral area (45.1%) | ||||||||
| Schreiber W. et al. [38] 2020 | Switzerland | Prospective longitudinal | 2008–2009 | 135 | 51 ± 11 (33.3) | 6 months | — | Vitamin D deficiency (65.2%) |
| Segaud N. et al. [39] 2018 | France | Prospective longitudinal | 2005–2011 | 259 | 49.7 ± 12.1 (37.1) | 8.8 ± 1.9 months | 38.4 months | Osteopenia: femoral area (42.9%) |
| Osteoporosis: femoral area (40.9%) | ||||||||
| Fractures (10.8%) | ||||||||
| Simbolon FR. et al. [40] 2018 | Taiwan | Retrospective longitudinal | 1997–2010 | 5,917 | 45.1 ± 11.9 (48.6) | 32.4 months | — | Gout (8.8%) |
| Stamp L. et al. [41] 2006 | New Zealand | Cross-sectional | 2004 | 202 | 53 (31.9) | >36 months | — | Gout (23.3%) |
| Torres A. et al. [42] 2016 | Spain | Cross-sectional | 2008–2010 | 727 | 55 ± 13.6 (39.9) | >12 months | 67 ± 29 months | Hypercalcemia (6.5%) |
| Hypophosphatemia (6.2%) | ||||||||
| Hyperparathyroidism (76.9%) | ||||||||
| Hypovitaminosis D (83.2%): insufficiency (50.8%); deficiency (32.5%) | ||||||||
| Fractures (14.6%) | ||||||||
| Velioglu A. et al. [43] 2021 | Turkey | Cross-sectional | 2017–2018 | 153 | 46.5 ± 11.9 (50.3) | 86.4 months | 35 months | Hyperparathyroidism (52.9%) |
| Hypovitaminosis D (68.8%): insufficiency (49.7%); deficiency (19%) | ||||||||
| Osteopenia: lumbar area (28.1%); femoral area (41.2%) | ||||||||
| Osteoporosis: lumbar area (7.2%); femoral area (7.8%) | ||||||||
| Fractures (43.4%) | ||||||||
| Vilarta CF. Et al [44]. 2017 | Brazil | Cross-sectional | — | 149 | 44 ± −(56.4) | 72 months | — | Hypovitaminosis D (79.2%): insufficiency (37.6%); deficiency (41.6%) |
| Fractures (10%) | ||||||||
| Wang C. et al. [45] 2021 | China | Cross-sectional | — | 216 | 41.5 ± 9.9 (27.8) | — | 15 months | Hypercalcemia (8.8%) |
| Hypophosphatemia (3.7%) | ||||||||
| Hypovitaminosis D (78.7%): insufficiency (46.3%); deficiency (32.4%) | ||||||||
| Fractures (3.2%) | ||||||||
| Weng SC. et al. [46] 2014 | Taiwan | Prospective longitudinal | 1999–2013 | 880 | 48.7 ± 12.3 (46.8) | — | — | Hyperuricemia (44.2%) |
| Gout (17.7%) | ||||||||
| Wolf M. et al. [47] 2016 | United States | Prospective longitudinal | — | 246 | 52.8 ± 13.4 (36.7) | — | 42 ± 34.8 months | -Hypercalcemia (30.5%) |
| -Hypophosphatemia (53.7%) | ||||||||
| -Hyperparathyroidism (89.4%) | ||||||||
| Zhang K. et al. [48] 2015 | China | Retrospective longitudinal | 2008–2011 | 573 | 41.4 ± 9.5 (31.6) | 1 month | — | -Hyperuricemia (16.2%) |
| 3 months | -Hyperuricemia (24.1%) | |||||||
| 24 months | -Hyperuricemia (30.9%) | |||||||
| 36 months | -Hyperuricemia (42.8%) | |||||||
Characteristics of the studies included (n = 38).
Two reviewers (AH-C and MG-M) independently conducted the data extraction, and disagreements were resolved by consensus or by a third reviewer (CB-M). Articles retrieved were imported and managed by Mendeley reference manager.
Methodological Quality Assessment
To assess the methodological quality of the studies included in this systematic review and meta-analysis, we used the Joanna Briggs Institute (JBI) tool “Checklist for prevalence studies” scale by Munn et al [49] for cross-sectional descriptive studies and the JBI tool “Checklist for cohort studies” scale by Moola et al [50] for longitudinal cohort studies. Both scales [49, 50] consist of 9 and 11 items, respectively. They are scored as “yes” (1), “no” (0), “not applicable” (NA) and “unclear” (?). The final score for each study therefore ranged from 0 to 9 or 11. Depending on this score, each study was classified as having a low (>7), moderate (4–6) or high (1–3) risk of bias [49, 50].
Both the data extraction and the quality assessment were performed independently by two reviewers (AH-C and MG-M), and disagreements were resolved by consensus or by involving a third reviewer (CB-M).
Statistical Analysis and Data Synthesis
Pooled prevalence estimates with their respective 95% confidence intervals (CIs) were calculated for each subgroup of musculoskeletal disorders (sarcopenia, low muscle strength, and low muscle mass, osteopenia, osteoporosis, fractures, and gout) and metabolic disorders subgroup (hypercalcemia, hypophosphatemia, hyperparathyroidism, hyperuricemia, and hypovitaminosis D). In addition, the overall pooled prevalence of both musculoskeletal and metabolic disorders was also estimated. DerSimonian and Laird random-effects method [51, 52] was used to calculate pooled prevalence estimates and their 95% CIs. Heterogeneity between studies was assessed using the I2 statistic [53] with values considered as follows: not important (0%–40%), moderate (30%–60%), substantial (50%–90%) and considerable heterogeneity (75%–100%). The significance value of the pooled effect size was estimated based on the 95% CI. Two-sided p values of .05 or less were considered significant.
We conducted a sensitivity analysis to determine the robustness of the summary estimates by removing each included study from the analysis one by one. Furthermore, meta-regression models were performed considering mean age, percentage of women, time on hemodialysis prior to transplant, and time since transplant to determine their influence on prevalence estimates. Due to the limited number of studies included (n < 10) in each subgroup analysis, meta-regression analysis was only performed with the following outcome variables: osteopenia (lumbar area), osteopenia (femoral area), osteoporosis (lumbar area), osteoporosis (femoral area) and fractures.
Statistical analyses were performed using Stata SE software, version 15 (StataCorp) and Comprehensive Meta-Analysis V3. Global prevalence was estimated using the STATA metaprop statistical package.
Results
Study Selection
A total of 1,770 articles were retrieved from the bibliographic search. After removing duplicates, a total of 38 articles [–48] were selected for quantitative synthesis (Figure 1).
FIGURE 1
Characteristics of the Selected Studies
The characteristics of the studies selected for this systematic review and meta-analysis are detailed in Table 1. The study design was cross-sectional in 27 studies [, , , , –, –, 34–37, 41–45] (71.1%) and longitudinal in 11 [, , , , , 38–40, 46–48] (28.9%). All these articles were published between 2001 and 2021, and most of them were conducted in Europe [, , , –, –, 35, 36, 38, 39, 42] (44.7%), although there were also studies from Asia [, , –, 34, 37, 40, 43, 45, 46, 48] (31.6%), America [, , , , , 44, 47] (18.4%) and Oceania [, 41] (5.3%).
A total of 21,879 patients (41.4% women) with a mean age of 45.4 years were analysed in this study. The kidney transplants were performed between 1971 and 2018. The mean time since transplantation was 41.3 months (3.4 years), and the mean time on dialysis before transplantation was 36.08 months (3 years).
The musculoskeletal disorders analysed in this review were sarcopenia, low muscle strength and low muscle mass, osteopenia and osteoporosis, bone fractures and gout. The outcomes analysed for metabolic disorders were hypercalcemia, hypophosphatemia, hyperparathyroidism, hyperuricemia and hypovitaminosis D.
Study Quality
Of the cross-sectional studies (Supplementary Table S2), 96.3% and 3.7% had a low and a moderate risk of bias, respectively. For longitudinal studies, 54.5% and 45.6% had a low and a moderate risk of bias, respectively (Supplementary Table S3). Considering all the studies, 84.2% and 15.8% had a low and moderate risk of bias, respectively.
Main Results
A general estimate of the outcomes regarding both musculoskeletal and metabolic disorders is shown in
Figures 2,
3, respectively. Each outcome was also independently analysed and is shown in
Supplementary Figures S1–S16. The overall proportion of kidney transplant patients with musculoskeletal disorders was 27.2 (95% CI: 18.4–36.0;
I2= 92.3%) (
Figure 2), and that with metabolic disorders was 37.6% (95% CI: 21.9–53.2;
I2= 97.8%) (
Figure 3).
(i) Musculoskeletal disorders
(a) Muscle disorders (sarcopenia, low muscle strength and low muscle mass): The prevalence of sarcopenia was analysed in five studies [, , , , 34]. A total of 816 individuals were included, with an overall prevalence of 23.6% (95% CI: 13.2–38.5; I2 = 94.1) (Supplementary Figure S1). Three studies [, , ], with 440 subjects, included the other two outcomes. For low muscle strength, the overall prevalence was 64.5% (95% CI: 43.1–81.3; I2 = 94.4), and the prevalence of low muscle mass was 39.5% (95% CI: 20.3–62.6; I2 = 95.3) (Supplementary Figures S2, S3).
(b) Osteopenia and osteoporosis: Eleven articles [, , –, , , , 36, 37, 43] investigated the prevalence in the lumbar area, and 12 [, , –, , , 35–37, 39, 43] studied the prevalence in the femoral area, with 3,021 and 3,339 transplant recipients, respectively. The prevalence of osteopenia in the lumbar area was 30.7% (95% CI: 23.3–39.3; I2 = 95.1). In the femoral area, it was 42.6% (95% CI: 36.5–48.8; I2 = 91.9) (Supplementary Figures S4, S5). For lumbar osteoporosis, the prevalence was 13.8% (95% CI: 10.4–17.9; I2 = 88.2). Finally, for the femoral area, the prevalence was 19.2% (95% CI: 13.4–26.7; I2 = 95.6) (Supplementary Figures S6, S7).
(c) Fractures: Eleven articles [, , , , , 36, 39, 42–45] assessed this outcome. The prevalence in 3,736 patients was 13.1% (95% CI: 9.6–18.5; I2 = 93.1) (Supplementary Figure S8).
(d) Gout: Three studies [40, 41, 46] analysed the prevalence of this disorder in renal transplant recipients, including 6,999 participants, where the overall prevalence of gout was 15.4% (95% CI: 8.3–26.9; I2 = 97.3) (Supplementary Figure S9).
(ii) Metabolic disturbances.
(a) Hypercalcaemia: Seven studies [, , , , 42, 45, 47] provided data on this disorder, with a total of 3,165 subjects analysed. The overall prevalence in this population was 15.7% (95% CI: 14.5–17.0; I2 = 91.3) (Supplementary Figure S10).
(b) Hypophosphatemia: Four studies [, 42, 45, 47] analysed the prevalence of hypophosphatemia among kidney transplant recipients. The overall prevalence of 1,365 individuals was 12.4% (95% CI: 4.3–31.2; I2 = 98.1) (Supplementary Figure S11).
(c) Hyperparathyroidism: The prevalence of this disorder was obtained from seven studies [, , , 37, 42, 43, 47]. The overall prevalence obtained in this population of 2,536 subjects was 47.6% (95% CI: 31.3–64.5; I2 = 98.2) (Supplementary Figure S12).
(d) Hyperuricemia: Hyperuricemia was analysed in five studies [, , , 46, 48], with a total of 6,328 subjects, with metabolic disorders having the largest population. The overall prevalence was 29.8% (95% CI: 23.8–36.7; I2 = 96.8) (Supplementary Figure S13).
(e) Hypovitaminosis D: Eight studies [, , , 37, 42–45] analysed the prevalence of this disorder. In this population of 2,495 people, the overall prevalence was 81.8% (95% CI: 67.2–90.8; I2 = 98.2), with this metabolic disorder being the most common finding (Supplementary Figure S14). This alteration was divided into vitamin D insufficiency and vitamin D deficiency. For the former, the prevalence was 44.9% (95% CI: 40.1–49.7; I2 = 80.7), and for vitamin D deficiency, it was 32.9% (95% CI: 23.1–44.4; I2 = 96.3) (Supplementary Figures S15, S16).
FIGURE 2
FIGURE 3
These results obtained have been compared with the results of other studies [54–61] that analyse the same variables in the general population (who have not received a kidney transplant). Among metabolic disturbances, the comparison is as follows: 14.9% vs. 0.8% (general population) for hypercalcemia, 58.0% vs. 0.8% for hyperparathyroidism, 31.2% vs. 13.3% for hyperuricemia, and 81.8% vs. 15.7% for hypovitaminosis D. Regarding musculoskeletal disorders, the differences are as follows: 23.6% vs. 15.5% for sarcopenia, 39.5% vs. 27.0% for low muscle mass, 30.7/42.6% (lumbar/femoral area) vs. 40.4% for osteopenia, 13.8/19.2% (lumbar/femoral area) vs. 18.3% for osteoporosis, 14.2% vs. 1.1% for fractures, and 15.4% vs. 1.1% for gout. This comparison is shown in detail in Supplementary Tables S4, S5, and individually the comparison of each variable can be seen in Supplementary Figures S17–S26.
Sensitivity and Meta-Regression Analysis
When the impact of individual studies was examined by removing studies from the analysis one by one, the estimate of the proportion of sarcopenia changed after removing the Limirio LS. sample [] (from 23.6% to 19.1%); Menna Barreto ANP. [] for low muscle strength (from 64.5% to 71.4%); Limirio LS. [] for low muscle mass (from 39.5% to 29.1%); Wang C. [45] for fractures (from 13.10% to 16.0%), and Simbolon FR. [40] for gout (from 15.4% to 19.9%) (Supplementary Table S6). On the other hand, regarding the estimated proportions of metabolic disorders, these were modified after removing the samples of Wolf M. [47] for hypercalcemia (from 15.7% to 13.0%) and hypophosphatemia (from 12.4% to 7.7%), and Evenepoel P. [] for vitamin D deficiency (from 32.9% to 40.0%) (Supplementary Table S7).
Meta-regression models showed that all the variables considered (age, %females, time since transplant and time on haemodialysis prior to transplant) influenced the prevalence estimates of the outcome variables analysed (Supplementary Table S8).
Discussion
The main objective of this systematic review and meta-analysis was to provide a complete synthesis of the prevalence of musculoskeletal disorders and metabolic disorders in kidney transplant patients. There is a wide range in the prevalence of metabolic disturbances and musculoskeletal disorders in this population. The most common metabolic disorders in this group of patients were hypovitaminosis D (81.8%), hyperparathyroidism (47.6%), and hyperuricemia (29.8%). Among the musculoskeletal disorders, the most common were low muscle strength (64.5%), femoral osteopenia (42.7%), and low muscle mass (39.5%).
Renal transplantation solves many problems of end-stage renal disease; however, certain metabolic disturbances may persist for some time. Hyperparathyroidism, hypercalcemia, hypophosphatemia, hypovitaminosis D, and hyperuricemia are common after transplantation, and they often occur simultaneously. In addition, together with other factors, they may be involved in the development of certain musculoskeletal disorders that affect the quality of life of the transplanted patient [62].
Despite the improvement in renal function after transplantation, hyperparathyroidism may develop due to a number of factors, including the high levels of parathyroid hormone (PTH) prior to transplantation, the prolonged period of renal disease and dialysis, the degree of hyperplasia of the parathyroid gland or the decrease in vitamin D [, 62–64]. PTH levels begin to decline during the first 3–6 months after the procedure, but according to the article published by Hassan et al [], high PTH levels can still be found in 30%–60% of patients 1 year after transplantation []. This alteration is also associated with hypercalcemia and hypophosphatemia, among others, which could lead to loss of BMD [].
Approximately 15% of patients with hyperparathyroidism also have hypercalcemia [65]. PTH increases blood calcium levels by transporting calcium from the bones into the blood, facilitating calcium reabsorption in the kidneys and its absorption in the digestive system [62]. However, it is not the only factor that allows an increase in blood calcium. The increase in vitamin D levels after transplantation also increases calcium absorption in the intestine, as well as the bone resorption that can occur after the procedure [, 62]. It is important to emphasize that hypercalcaemia is not a cause of BMD loss but rather a consequence [62]. This alteration is reported in 5%–15% of the transplanted population after the intervention, according to the article published by Bouquegneau et al [], and is more common at 3–6 months, especially in patients with higher blood PTH levels []. This change may resolve in some patients 6–8 months after transplantation, but in others, it may take years [64]. Hypercalcemia may play a role in triggering nephrolithiasis, rejection, and dysfunction of the transplanted kidney [65].
Another change associated with hyperparathyroidism is hypophosphatemia. Like calcium, PTH is involved in the regulation of phosphorus in the body [62]. In addition, there is another hormone in the body called fibroblast growth factor 23 (FGF-23), which has been identified as the main phosphorus-regulating factor in the body. This hormone is secreted by bone cells, and its production is partially stimulated by PTH. It has also been described that excess FGF-23 [66] is produced in bone mineralization disorders. These two hormones contribute to a decrease in the reabsorption of phosphorus in the kidney, which is why kidney transplant recipients have low levels of this metabolite [64]. This alteration is common during the first 3 months after transplantation, and according to the study by Bouquegneau et al [], it occurs in 50% of transplant recipients and stabilizes after 6–12 months [, 67]. This alteration is associated with a decrease in osteoblast activity, resulting in deficient bone mineralization [].
Vitamin D metabolism is also affected after renal transplantation. Hypovitaminosis D is associated with immunosuppressive therapy, residual renal function after transplantation, malabsorption, poor diet or reduced exposure to sunlight [62, 64]. The vitamin D status of the body is tested by blood levels of calcidiol, a precursor of this vitamin; hypovitaminosis D is therefore understood to be a blood level of calcidiol of less than 30 ng/mL, with vitamin D insufficiency being between 15 and 30 ng/mL and vitamin D deficiency being less than 15 ng/mL [44, 68]. According to the article published by Evenepoel et al, [68] the prevalence of hypovitaminosis D in the third month after renal transplantation is 78%, and according to the articles by Bouquegneau et al [] and Alshayeb et al, [64] vitamin D deficiency would be present in 30% of the operated patients. As renal function recovers, vitamin D levels begin to rise, although they remain lower than those of the general population (Supplementary Table S4) [, 62]. Hypovitaminosis D may be associated with lower transplant tolerance, worsening infections, and an upset in BMD [].
This BMD alteration is associated with both osteopenia and osteoporosis, as mentioned above, with various metabolic disturbances that occur after renal transplantation []. Although there are also several risk factors, such as advanced age, sex, and ethnicity of the patient [, ], the main underlying factor for BMD loss is treatment with glucocorticoids after transplantation. Glucocorticoids inhibit bone tissue formation and increase osteoclast activity by decreasing the formation and differentiation of osteoblasts [69]. The difference between osteopenia and osteoporosis is the amount of BMD lost, with osteoporosis considered a more severe pathology than osteopenia. These disorders occur most frequently in the first 6–12 months after transplantation, with the greatest loss of BMD in the first 6 months [70]. In our meta-regression analysis, we have also shown a negative correlation between the time of transplantation and the prevalence of osteoporosis and osteopenia [, 70]. After 6 months, this loss of bone mineral slows down, probably due to the decrease in glucocorticoid use and the gradual correction of the various metabolic disturbances associated with these disorders. According to the study published by Ebeling et al, [71] the presence of osteoporosis can be found in 17%–49% of kidney transplant recipients in the lumbar area and in 11%–56% of patients transplanted in the femoral area [71]. In our meta-analysis, the prevalence of osteoporosis in the lumbar area was 13.8%. In contrast, in the femoral area, the prevalence was 19.2%.
The main consequence of BMD loss is an increased risk of fractures [], although there are several factors, such as advanced age, loss of muscle mass and reduced physical activity, that may increase the risk of this adverse event []. Approximately 22.5% of patients suffer at least one fracture in the first 5 years after transplantation, which means an incidence 4 times higher than that for the general population but lower than that in patients who remain on dialysis (Supplementary Table S5) []. Fractures are associated with increased hospitalization and mortality in kidney transplant recipients, with hip, ankle, and foot fractures being the most common, suggesting a large economic impact [, 72, 73]. In our study, the prevalence of fractures after transplant was 14.2%.
Another factor that could increase the risk of fractures in transplant recipients is the loss of muscle mass and muscle strength associated with sarcopenia, which is associated with an increased risk of falls, physical disability, lower quality of life and greater morbidity and mortality [73]. The main risk factors for sarcopenia in kidney transplant recipients are vitamin D deficiency, physical inactivity, prolonged hospitalization, nutritional deficiencies, hyperparathyroidism, and proteinuria [, 74]. The prevalence of this condition, whose occurrence in kidney transplant recipients is estimated at a younger age in comparison with the general population [75], varies greatly because there are no universal diagnostic criteria. In addition, together with osteopenia and osteoporosis, the risk of fracture in these patients increases considerably [].
On the other hand, gout, which is a type of arthritis that occurs after the deposition of uric acid crystals in the joints, causing attacks of pain and inflammation, is another disorder that could be associated with kidney transplantation [76]. The main cause for this disorder is hyperuricemia, a metabolic disturbance that is common after renal transplantation. According to the article by Gupta et al, [77] hyperuricemia could reach a prevalence of 10%–84%, while gout could be present in 2%–28% of transplant recipients. In our study, the prevalence of gout was specifically 15.4%, although the differences in the date of transplantation between the three included studies may limit the generalisability of this estimate.
In order to compare these results, we have found a series of studies [54–61] that provide prevalence data for the variables analysed in the general population (Supplementary Tables S4, S5; Supplementary Figures S17–S26). It should be noted that for the variables of hypophosphatemia and low muscle strength, we have not been able to find any study providing prevalences in the general population. As for the other variables, we can observe the large difference in prevalence estimates between the transplanted population and the general population for hypercalcemia [54], hyperparathyroidism [55], hyperuricemia [55], hypervitaminosis D [56], sarcopenia [57], low muscle mass [58], fractures [59] and gout [55], indicating an increase in the prevalence of these metabolic disturbances and musculoskeletal disorders after kidney transplantation. In the case of osteopenia and osteoporosis, the difference in prevalence between the two populations is small, although it is true that in the studies [60, 61] we have found in the general population, it is not divided into zones, as it is in the studies [, , –, , , , 35–37, 39, 43] in the transplanted population, which divide the prevalence into lumbar and femoral areas, so that no conclusions could be drawn when comparing the two populations with regard to these two variables analysed.
This study has several potential limitations, and its findings should be interpreted with some caution. First, they are inherent to the conduct of a systematic review and meta-analysis (selection bias and limited information reported by original studies). Second, the design of most studies was retrospective and cross-sectional, which does not allow establishing a cause-effect relationship. Additionally, the heterogeneity of the results was high, which may limit the extrapolation of data to different populations. Thirdly, the results should be interpreted with caution, given the pooling of studies from different years and geographical locations, with different circumstances and sample characteristics. In this sense, studies were conducted in five different decades, in which the surgical techniques, metabolic goals, and available medications may have been different. On the other hand, there was variability in the time at which the different outcomes were measured after transplantation. Finally, despite the physiological link between hyperparathyroidism and hypercalcemia and hypophosphatemia, our results did not show a clear association between their prevalence estimates. The main reasons for this finding could be the coexistence of some lifestyle-related covariates that were not included in the original analyses, and the small number of studies (only three) that analysed the prevalence of the three outcomes (low muscle strength, low muscle mass and gout), whose sample sizes were not very large. However, the aim of this study was to show the prevalence of different kidney transplant-related disorders.
Conclusion
In conclusion, this systematic review and meta-analysis shows a high prevalence regarding the presence of certain musculoskeletal disorders and their related metabolic disorders in kidney transplant recipients. Hypovitaminosis D, hyperparathyroidism and hyperuricemia were the most common metabolic disturbances. In parallel, low muscle strength, femoral osteopenia and low muscle mass were the main musculoskeletal disorders. At a clinical level, knowledge of these data will allow us to improve the prevention, diagnosis, and treatment of these complications, increase patient wellbeing, reduce the recovery time after surgery and avoid increased hospitalizations, morbidity, and mortality in kidney transplant patients, although further research is needed using experimental designs to test the effectiveness of different therapeutic prevention strategies in this specific population.
Statements
Author contributions
AH-C had full access to all the data in the study and takes responsibility for the integrity of the data and the accuracy of the data analysis. AH-C, MG-M, and CB-M designed the study; AH-C, MG-M, CB-M, and VM-V performed the data analysis, and AT-C, CP-M, LH-C, and IS-D interpreted the findings. All authors contributed to the article and approved the submitted version.
Funding
The project received a research grant from the Carlos III Institute of Health, Ministry of Economy and Competitiveness (Spain), awarded on the call for the creation of Health Outcomes-Oriented Cooperative Research Networks (RICORS), with reference RD21/0016/0025, co-funded with European Union—NextGenerationEU funds. Additional funding was obtained from the Research Network on Preventative Activities and Health Promotion (RD12/0005/0009) to VM-V Likewise, this study was funded by European Regional Development Fund (ERDF) and by the Carvascare Research Group (2022-GRIN-34459 Carvascare Research Group).
Conflict of interest
The authors declare that the research was conducted in the absence of any commercial or financial relationships that could be construed as a potential conflict of interest.
Supplementary material
The Supplementary Material for this article can be found online at: https://www.frontierspartnerships.org/articles/10.3389/ti.2024.12312/full#supplementary-material
Abbreviations
BMD, Bone mineral density; CI, Confidence intervals; FGF-23, Fibroblast growth factor 23; GODT3, Global Observatory on Donation and Transplantation; JBI, Joanna Briggs Institute; MOOSE, Meta-analyses of Observational Studies in Epidemiology; PRISMA, Preferred Reporting Items for Systematic Reviews and Meta-Analysis; PROSPERO, International Prospective Register of Systematic Reviews; PTH, Parathyroid hormone; WOS, Web of Science.
References
1.
ValdiviaAJGutiérrezGCMéndezFDDelgadoAETretoRJFernándezMI. Supervivencia en pacientes con trasplante renal. Factores pronósticos. Invest Medicoquir (2013) 5(2):253–75.
2.
MainraRElderG. Review Article: Managing Bone Complications After Kidney Transplantation. Nephrology (Carlton) (2009) 14(4):437–42. 10.1111/j.1440-1797.2009.01156.x
3.
WHO. Global Observatory on Donation and Transplantation. Geneva: WHO-ONT (2007). Available from: http://www.transplant-observatory.org/export-database/ (Accessed April 12, 2022).
4.
BiaM. Evaluation and Management of Bone Disease and Fractures Post Transplant. Transpl Rev (Orlando) (2008) 22(1):52–61. 10.1016/j.trre.2007.09.001
5.
KhairallahPNickolasTL. Bone and Mineral Disease in Kidney Transplant Recipients. Clin J Am Soc Nephrol (2022) 17(1):121–30. 10.2215/CJN.03410321
6.
HassanABGhalibKWJahramiHAEl-AgroudyAE. Prevalence of Musculoskeletal Manifestations in Adult Kidney Transplant's Recipients: A Systematic Review. Medicina (Kaunas) (2021) 57(6):525. 10.3390/medicina57060525
7.
YanishiMKinoshitaHTsukaguchiHKimuraYKoitoYSugiMet alFactors Related to Osteosarcopenia in Kidney Transplant Recipients. Transpl Proc (2018) 50(10):3371–5. 10.1016/j.transproceed.2018.04.032
8.
MolnarMZNaserMSRheeCMKalantar-ZadehKBunnapradistS. Bone and Mineral Disorders After Kidney Transplantation: Therapeutic Strategies. Transpl Rev (Orlando) (2014) 28(2):56–62. 10.1016/j.trre.2013.12.003
9.
BouquegneauASalamSDelanayePEastellRKhwajaA. Bone Disease After Kidney Transplantation. Clin J Am Soc Nephrol (2016) 11(7):1282–96. 10.2215/CJN.11371015
10.
PageMJMcKenzieJEBossuytPMBoutronIHoffmannTCMulrowCDet alThe PRISMA 2020 Statement: An Updated Guideline for Reporting Systematic Reviews. Syst Rev (2021) 10(1):89. 10.1186/s13643-021-01626-4
11.
AlagozSTrabulusS. Long-Term Evaluation of Mineral Metabolism After Kidney Transplantation. Transpl Proc (2019) 51(7):2330–3. 10.1016/j.transproceed.2019.01.181
12.
AminTCoatesPTBarbaraJHakendorfPKarimN. Prevalence of Hypercalcaemia in a Renal Transplant Population: A Single Centre Study. Int J Nephrol (2016) 2016:7126290. 10.1155/2016/7126290
13.
BatteuxBBodeauSAndréCHurtel-LemaireASGras-ChampelVDesailly-HenryIet alAssociation Between Uremic Toxin Concentrations and Bone Mineral Density After Kidney Transplantation. Toxins (Basel) (2020) 12(11):715. 10.3390/toxins12110715
14.
BergaJKCrespo AlbiachJBeltran CatalanSGavela MartinezESancho CalabuigAAvila BernabeuAet alVitamin D Deficiency in a Renal Transplant Population: Safe Repletion With Moderate Doses of Calcidiol. Transpl Proc (2010) 42(8):2917–20. 10.1016/j.transproceed.2010.08.015
15.
JúniorJWRBNevesRMPinheiroMMFrisoli JúniorACastroCHSzejnfeldVLet alPrevalence of Low Trauma Fractures in Long-Term Kidney Transplant Patients With Preserved Renal Function. Braz J Med Biol Res (2006) 39(1):137–47. 10.1590/s0100-879x2006000100016
16.
ChanWChinSHWhittakerACJonesDKaurOBoschJAet alThe Associations of Muscle Strength, Muscle Mass, and Adiposity With Clinical Outcomes and Quality of Life in Prevalent Kidney Transplant Recipients. J Ren Nutr (2019) 29(6):536–47. 10.1053/j.jrn.2019.06.009
17.
ConleyEMuthBSamaniegoMLotfiMVossBArmbrustMet alBisphosphonates and Bone Fractures in Long-Term Kidney Transplant Recipients. Transplantation (2008) 86(2):231–7. 10.1097/TP.0b013e318176b40f
18.
EinollahiBEinollahiHNafarMRostamiZ. Prevalence and Risk Factors of Hyperuricemia Among Kidney Transplant Recipients. Indian J Nephrol (2013) 23(3):201–5. 10.4103/0971-4065.111849
19.
EvenepoelPClaesKMeijersBLaurentMRBammensBNaesensMet alBone mineral Density, Bone Turnover Markers, and Incident Fractures in De Novo Kidney Transplant Recipients. Kidney Int (2019) 95(6):1461–70. 10.1016/j.kint.2018.12.024
20.
Fernández CastilloRFernández GallegosRPeña AmaroMPEsteban de la RosaRJ. Valoración del perfil lipídico y de la densidad mineral ósea en pacientes trasplantados renales. Nutr Hosp (2015) 31(6):2503–10. 10.3305/nh.2015.31.6.8719
21.
GregoriniMSilenoGPattonieriEFCorradettiVAbelliMTicozzelliEet alUnderstanding Bone Damage After Kidney Transplantation: A Retrospective Monocentric Cross Sectional Analysis. Transpl Proc (2017) 49(4):650–7. 10.1016/j.transproceed.2017.02.023
22.
Hamidian JahromiARoozbehJRaiss-JalaliGADabaghmaneshAJalaeianHBahadorAet alRisk Factors of Post Renal Transplant Hyperparathyroidism. Saudi J Kidney Dis Transpl (2009) 20(4):573–6.
23.
JermanALindičJŠkoberneABorštnarŠMartinuč BergočMGodnovUet alPrevalence and Risk Factors for Nonvertebral Bone Fractures in Kidney Transplant Recipients - A Single-Center Retrospective Analysis. Clin Nephrol (2017) 88(13):101–8. 10.5414/CNP88FX23
24.
JørgensenHSEideIAHartmannAÅsbergAChristensenJHSchmidtEBet alPlasma N-3 Polyunsaturated Fatty Acids and Bone Mineral Density in Renal Transplant Recipients. J Ren Nutr (2016) 26(3):196–203. 10.1053/j.jrn.2015.11.007
25.
KhosraviMSoltanianNMonfaredAGhanbariARamezanzadeEKazemnezhad LeyliE. Bone Mineral Density and Related Factors in Renal Transplant Recipients, in the North of Iran. Iran J Kidney Dis (2020) 14(5):405–11.
26.
KimKMKimSSHanDJYangWSParkJSParkSK. Hyperuricemia in Kidney Transplant Recipients With Intact Graft Function. Transpl Proc (2010) 42(9):3562–7. 10.1016/j.transproceed.2010.07.104
27.
KosokuAUchidaJNishideSKabeiKShimadaHIwaiTet alAssociation of Sarcopenia With Phase Angle and Body Mass index in Kidney Transplant Recipients. Sci Rep (2020) 10(1):266. 10.1038/s41598-019-57195-z
28.
LimirioLSSantosHODos ReisASde OliveiraEP. (Dis) Agreement Between the First and the Recent European Consensus on Definition and Diagnosis for Sarcopenia in Kidney Transplant Patients. Eur J Clin Nutr (2020) 74(7):1104–8. 10.1038/s41430-019-0535-5
29.
López RuizMCOrtega MartínezARFernández CastilloREsteban de la RosaRJBravo SotoJA. Osteoporosis e índice de masa corporal en el trasplantado renal. Nutr Hosp (2015) 32(2):872–7. 10.3305/nh.2015.32.2.9166
30.
MalheiroJAlmeidaMFonsecaIMartinsLSPedrosoSDiasLet alHyperuricemia in Adult Renal Allograft Recipients: Prevalence and Predictors. Transpl Proc (2012) 44(8):2369–72. 10.1016/j.transproceed.2012.07.033
31.
MarcénRPonteBRodríguez-MendiolaNFernández-RodriguezAGaleanoCVillafruelaJJet alVitamin D Deficiency in Kidney Transplant Recipients: Risk Factors and Effects of Vitamin D3 Supplements. Transpl Proc (2009) 41(6):2388–90. 10.1016/j.transproceed.2009.06.050
32.
MennaBAPMBarreto SilvaMIPontesKSDSCostaMSDRosinaKTCSouzaEet alSarcopenia and Its Components in Adult Renal Transplant Recipients: Prevalence and Association With Body Adiposity. Br J Nutr (2019) 122(12):1386–97. 10.1017/S0007114519002459
33.
MuirheadNZaltmanJSGillJSChurchillDNPoulin-CostelloMMannVet alHypercalcemia in Renal Transplant Patients: Prevalence and Management in Canadian Transplant Practice. Clin Transpl (2014) 28(2):161–5. 10.1111/ctr.12291
34.
OzkayarNAltunBHalilMKuyumcuMEArikGYesilYet alEvaluation of Sarcopenia in Renal Transplant Recipients. Nephrourol Mon (2014) 6(4):e20055. 10.5812/numonthly.20055
35.
ParkWYHanSChoiBSParkCWYangCWKimYSet alProgression of Osteoporosis After Kidney Transplantation in Patients With End-Stage Renal Disease. Transpl Proc (2017) 49(5):1033–7. 10.1016/j.transproceed.2017.03.038
36.
PatelSKwanJTMcCloskeyEMcGeeGThomasGJohnsonDet alPrevalence and Causes of Low Bone Density and Fractures in Kidney Transplant Patients. J Bone Miner Res (2001) 16(10):1863–70. 10.1359/jbmr.2001.16.10.1863
37.
SavajSGhodsFJ. Vitamin D, Parathyroid Hormone, and Bone Mineral Density Status in Kidney Transplant Recipients. Iran J Kidney Dis (2012) 6(4):295–9.
38.
SchreiberPWKusejkoKBischoff-FerrariHABoggianKBonaniMvan DeldenCet alVitamin D Deficiency Is Common in Kidney Transplant Recipients, But Is Not Associated With Infections After Transplantation. Clin Transpl (2020) 34(2):e13778. 10.1111/ctr.13778
39.
SegaudNLegrouxIHazzanMNoelCCortetB. Changes in Bone Mineral Density After Kidney Transplantation: 2-Year Assessment of a French Cohort. Osteoporos Int (2018) 29(5):1165–75. 10.1007/s00198-018-4383-2
40.
SimbolonFRLeeSSTsaiYCTsaiWCLinGTTungYCet alRisk of Incident Gout in Kidney Transplant Recipients: A Retrospective Cohort Study. Int J Rheum Dis (2018) 21(11):1993–2001. 10.1111/1756-185X.13393
41.
StampLHaLSearleMO'DonnellJFramptonCChapmanP. Gout in Renal Transplant Recipients. Nephrology (Carlton) (2006) 11(4):367–71. 10.1111/j.1440-1797.2006.00577.x
42.
TorresATorregrosaVMarcenRCampistolJMAriasMHernándezDet alMineral Metabolism Disorders, Vertebral Fractures and Aortic Calcifications in Stable Kidney Transplant Recipients: The Role of Gender (EMITRAL Study). Nefrologia (2016) 36(3):255–67. 10.1016/j.nefro.2016.03.004
43.
VeliogluAKayaBAykentBOzkanBKarapinarMSArikanHet alLow Bone Density, Vertebral Fracture and FRAX Score in Kidney Transplant Recipients: A Cross-Sectional Cohort Study. PLoS One (2021) 16(4):e0251035. 10.1371/journal.pone.0251035
44.
VilartaCFUngerMDDos ReisLMDominguezWVDavid-NetoEMoysésRMet alHypovitaminosis D in Patients Undergoing Kidney Transplant: The Importance of Sunlight Exposure. Clinics (Sao Paulo) (2017) 72(7):415–21. 10.6061/clinics/2017(07)05
45.
WangCHuoYLiXLinAHuQXiongCet alFactors Related to Bone Metabolism in Kidney Transplant Recipients. Mediators Inflamm (2021) 2021:6679095. 10.1155/2021/6679095
46.
WengSCShuKHTarngDCChengCHChenCHYuTMet alUric Acid Is Highly Associated With Kidney Allograft Survival in a Time-Varying Analysis. Transpl Proc (2014) 46(2):505–10. 10.1016/j.transproceed.2013.09.038
47.
WolfMWeirMRKopytNMannonRBVon VisgerJDengHet alA Prospective Cohort Study of Mineral Metabolism After Kidney Transplantation. Transplantation (2016) 100(1):184–93. 10.1097/TP.0000000000000823
48.
ZhangKGaoBWangYWangGWangWZhuYet alSerum Uric Acid and Renal Transplantation Outcomes: At Least 3-Year Post-Transplant Retrospective Multivariate Analysis. PLoS One (2015) 10(7):e0133834. 10.1371/journal.pone.0133834
49.
MunnZMoolaSLisyKRiitanoDTufanaruC. Methodological Guidance for Systematic Reviews of Observational Epidemiological Studies Reporting Prevalence and Cumulative Incidence Data. Int J Evid Based Healthc (2015) 13(3):147–53. 10.1097/XEB.0000000000000054
50.
MoolaSMunnZTufanaruCAromatarisESearsKSfetcuRet alChapter 7: Systematic Reviews of Etiology and Risk. In: AromatarisEMunnZ, editors. JBI Manual for Evidence Synthesis. Australia: JBI (2020). Available from: https://synthesismanual.jbi.global (Accessed May 20, 2022).
51.
MantelNHaenszelW. Statistical Aspects of the Analysis of Data From Retrospective Studies of Disease. J Natl Cancer Inst (1959) 22:719–48.
52.
DerSimonianRKackerR. Random-Effects Model for Meta-Analysis of Clinical Trials: An Update. Contemp Clin Trials (2007) 28:105–14. 10.1016/j.cct.2006.04.004
53.
HigginsJThompsonSG. Quantifying Heterogeneity in a Meta-Analysis. Stat Med (2002) 21:1539–58. 10.1002/sim.1186
54.
LindnerGFelberRSchwarzCMartiGLeichtleABFiedlerGMet alHypercalcemia in the ED: Prevalence, Etiology, and Outcome. Am J Emerg Med (2013) 31(4):657–60. 10.1016/j.ajem.2012.11.010
55.
Soto-PedreENeweyPJLeeseGP. Stable Incidence and Increasing Prevalence of Primary Hyperparathyroidism in a Population-Based Study in Scotland. J Clin Endocrinol Metab (2023) 108(10):e1117–e1124. 10.1210/clinem/dgad201
56.
CuiAZhangTXiaoPFanZWangHZhuangY. Global and Regional Prevalence of Vitamin D Deficiency in Population-Based Studies From 2000 to 2022: A Pooled Analysis of 7.9 Million Participants. Front Nutr (2023) 10:1070808. 10.3389/fnut.2023.1070808
57.
Sepúlveda-LoyolaWOsadnikCPhuSMoritaAADuqueGProbstVS. Diagnosis, Prevalence, and Clinical Impact of Sarcopenia in COPD: A Systematic Review and Meta-Analysis. J Cachexia Sarcopenia Muscle (2020) 11(5):1164–76. 10.1002/jcsm.12600
58.
Petermann-RochaFBalntziVGraySRLaraJHoFKPellJPet alGlobal Prevalence of Sarcopenia and Severe Sarcopenia: A Systematic Review and Meta-Analysis. J Cachexia Sarcopenia Muscle (2022) 13(1):86–99. 10.1002/jcsm.12783
59.
Court-BrownCMCaesarB. Epidemiology of Adult Fractures: A Review. Injury (2006) 37(8):691–7. 10.1016/j.injury.2006.04.130
60.
XiaoPLCuiAYHsuCJPengRJiangNXuXHet alGlobal, Regional Prevalence, and Risk Factors of Osteoporosis According to the World Health Organization Diagnostic Criteria: A Systematic Review and Meta-Analysis. Osteoporos Int (2022) 33(10):2137–53. 10.1007/s00198-022-06454-3
61.
SalariNGhasemiHMohammadiLBehzadiMHRabieeniaEShohaimiSet alThe Global Prevalence of Osteoporosis in the World: A Comprehensive Systematic Review and Meta-Analysis. J Orthop Surg Res (2021) 16:609. 10.1186/s13018-021-02772-0
62.
Kalantar-ZadehKMolnarMZKovesdyCPMucsiIBunnapradistS. Management of Mineral and Bone Disorder After Kidney Transplantation. Curr Opin Nephrol Hypertens (2012) 21(4):389–403. 10.1097/MNH.0b013e3283546ee0
63.
NevesCLdos ReisLMBatistaDGCustodioMRGraciolliFGMartinRCet alPersistence of Bone and Mineral Disorders 2 Years After Successful Kidney Transplantation. Transplantation (2013) 96(3):290–6. 10.1097/TP.0b013e3182985468
64.
AlshayebHMJosephsonMASpragueSM. CKD-Mineral and Bone Disorder Management in Kidney Transplant Recipients. Am J Kidney Dis (2013) 61(2):310–25. 10.1053/j.ajkd.2012.07.022
65.
SakhaeeK. Osteoporosis Following Organ Transplantation: Pathogenesis, Diagnosis and Management. Expert Rev Endocrinol Metab (2011) 6(2):157–76. 10.1586/eem.10.86
66.
Sánchez-GonzálezMCSalanovaLRuanoP. FGF-23: Solo regulador del metabolismo del fósforo o algo más?Reumatol Clin (2011) 7(2):5–7. 10.1016/j.reuma.2011.05.009
67.
HirukawaTKakutaTNakamuraMFukagawaM. Mineral and Bone Disorders in Kidney Transplant Recipients: Reversible, Irreversible, and De Novo Abnormalities. Clin Exp Nephrol (2015) 19(4):543–55. 10.1007/s10157-015-1117-z
68.
EvenepoelPNaesensMClaesKKuypersDVanrenterghemY. Tertiary 'Hyperphosphatoninism' Accentuates Hypophosphatemia and Suppresses Calcitriol Levels in Renal Transplant Recipients. Am J Transpl (2007) 7(5):1193–200. 10.1111/j.1600-6143.2007.01753.x
69.
SilkensenJR. Long-Term Complications in Renal Transplantation. J Am Soc Nephrol (2000) 11(3):582–8. 10.1681/ASN.V113582
70.
Pérez-SáezMJPrieto-AlhambrabDDíez-PérezAPascuaJ. Advances in the Evaluation of Bone Health in Kidney Transplant Patients. Nefro (Madrid) (2018) 38(1):27–33. 10.1016/j.nefro.2017.04.002
71.
EbelingPR. Transplantation Osteoporosis. Curr Osteoporos Rep (2007) 5(1):29–37. 10.1007/BF02938620
72.
NaylorKLLiAHLamNNHodsmanABJamalSAGargAX. Fracture Risk in Kidney Transplant Recipients: A Systematic Review. Transplantation (2013) 95(12):1461–70. 10.1097/TP.0b013e31828eead8
73.
WilliamsSADaigleSGWeissRWangYAroraTCurtisJR. Economic Burden of Osteoporosis-Related Fractures in the US Medicare Population. Ann Pharmacother (2021) 55(7):821–9. 10.1177/1060028020970518
74.
GandolfiniIRegolistiGBazzocchiAMaggioreUPalmisanoAPiottiGet alFrailty and Sarcopenia in Older Patients Receiving Kidney Transplantation. Front Nutr (2019) 6:169. 10.3389/fnut.2019.00169
75.
MartinsCAFrançaAKTCDiasRSCCostaRCOLemosAPLSantosAMDet alPrevalence of Sarcopenia in Kidney Transplants and Their Association With Determinant Factors of Muscle Homeostasis. Rev Assoc Med Bras (1992)2020) 66(9):1235–40. 10.1590/1806-9282.66.9.1235
76.
Pascual GómezESivera MascaróF. Hyperuricemia Y Gout. IT Del SNS (2009) 33(4):110–5.
77.
GuptaGUnruhMLNolinTDHasleyPB. Primary Care of the Renal Transplant Patient. J Gen Intern Med (2010) 25(7):731–40. 10.1007/s11606-010-1354-5
Summary
Keywords
renal transplant, musculoskeletal, metabolic, proportion, meta-analysis
Citation
Herreros-Carretero Á, Berlanga-Macías C, Martínez-Vizcaíno V, Torres-Costoso A, Pascual-Morena C, Hernández-Castillejo LE, Sequí-Domínguez I and Garrido-Miguel M (2024) Prevalence of Musculoskeletal and Metabolic Disorders in Kidney Transplant Recipients: A Systematic Review and Meta-Analysis. Transpl Int 37:12312. doi: 10.3389/ti.2024.12312
Received
26 October 2023
Accepted
08 April 2024
Published
24 April 2024
Volume
37 - 2024
Updates
Copyright
© 2024 Herreros-Carretero, Berlanga-Macías, Martínez-Vizcaíno, Torres-Costoso, Pascual-Morena, Hernández-Castillejo, Sequí-Domínguez and Garrido-Miguel.
This is an open-access article distributed under the terms of the Creative Commons Attribution License (CC BY). The use, distribution or reproduction in other forums is permitted, provided the original author(s) and the copyright owner(s) are credited and that the original publication in this journal is cited, in accordance with accepted academic practice. No use, distribution or reproduction is permitted which does not comply with these terms.
*Correspondence: Carlos Berlanga-Macías, carlos.berlanga@uclm.es
Disclaimer
All claims expressed in this article are solely those of the authors and do not necessarily represent those of their affiliated organizations, or those of the publisher, the editors and the reviewers. Any product that may be evaluated in this article or claim that may be made by its manufacturer is not guaranteed or endorsed by the publisher.