Abstract
In the context of space exploration, electrowetting-on-dielectric (EWOD) microfluidic systems hold substantial promise for enhancing in-situ analysis and experimentation, particularly given its potential for precise control of fluid dynamics in the microgravity environment. This study investigates the effects of electrowetting-induced parametric oscillations on mixing efficiency within coalesced micro-droplets in EWOD microfluidic devices using numerical simulations. The mechanism by which parametric oscillation affects the mixing process of micro-droplets in EWOD devices is unraveled, which is previously uninverstigated in the literature to the best of our knowledge. The simulations reveal that parametric oscillations significantly increase vorticity magnitude and shear rate around the droplet interface, leading to improved mixing compared to free oscillation. Notably, the study identifies fluctuations in the mixing index associated with the oscillation-induced shape changes of the droplets. These findings underscore the potential of parametric oscillation as a strategy for optimizing mixing in EWOD systems, with implications for the design of more efficient microfluidic devices.
Introduction
Microfluidic technology plays a pivotal role in space research, particularly with the use of lab-on-chip platforms for conducting astrobiological studies in the unique conditions of microgravity and radiation exposure [1], in addition to the diagnostic tools utilized for monitoring the health and living conditions of astronauts [2, 3]. Microfluidic platforms have demonstrated their potential in facilitating complex biological experiments performed in of the International Space Station (ISS) and CubeSat missions [4, 5], offering a compact and efficient means of conducting biomedical research in microgravity. The integration of microfluidic technology in proposed NASA and ESA missions, such as the “tissue chips” initiative [6–8] and the ESA-SPHEROIDS project [9, 10], exemplifies the progressive role of microfluidics in space biology, signaling a trend towards more advanced and integrated space research capabilities.
Electrowetting-on-dielectric (EWOD) constitutes an advanced technique in of digital microfluidics, enabling the precise manipulation of droplets with volumes ranging from picoliters to microliters [11] by modulating their wettability through the application of variable voltages, thereby facilitating the execution of complex laboratory procedures [12]. In year 2018, EWOD-based microfluidics has been used as electrowetting heat pipes on the ISS, and key microfluidic operations (droplet motion and splitting) are examined [13]. The findings indicate that electrowetting experiments are feasible in a space environment, suggesting that concerns pertaining to safety, reliability, and compactness can be effectively addressed [14].
On the other hand, due to the small size of micro-droplets and the limited diffusivity of most analytes and reagents within biochemical analysis systems, the majority of microfluidic species transport systems operate at low Reynolds numbers (characterizing laminar flow) and high Peclet numbers (indicating minimal diffusion) [15]. This combination renders mixing within micro-droplets a significant challenge and a critical issue in the field of microfluidics. Traditional methods for enhancing droplet mixing involve moving the coalesced droplet back and forth on a grid of electrodes, which oscillates the droplet to increase the interfacial area and promote diffusive processes [16–18]. Recently, a common approach to improve micro-droplet mixing in digital microfluidics is to generate oscillations within the combined droplet by applying AC voltage [19, 20]. Resonant droplet oscillation can be triggered by applying AC voltage in the EWOD microfluidics, which has been experimentally [19, 21–26] and numerically [27] proven as an effective approach to microfluid mixing. The shape oscillation brought about by the resonance mode can induces transient and chaotic convective vortices around the droplet, which greatly accelerates the mixing process [25, 28].
There are numerous studies on the oscillation of AC voltage-actuated droplets, but only a few testified to the oscillation’s applicability for mixing enhancement, and most of them are experiments [27]. Therefore, more numerical simulations are required to give detailed characteristics of the fluid flow by visualization of the internal flow within the droplet [29]. Based on the above analysis, this study presents a numerical examination of the influence of parametric oscillation on the mixing process of micro-droplets within digital microfluidic systems. The parametric oscillation is induced by the application of voltages with high amplitude and a driving frequency, , which is roughly double the resonance frequency of the droplet, . Throughout the parametric oscillation, the mixing index, , displays an oscillatory pattern over time. The mixing index fluctuation, denoted as , is extracted and analyzed. Additionally, the fluid dynamics triggered by the parametric oscillation and its effects on mixing efficacy are scrutinized. Our findings elucidate the underlying mechanisms by which parametric oscillation enhances mixing in electrowetting-driven merged micro-droplets.
Methods
In this section, the electrowetting mechanism that drives the droplet motion in digital microfluidics is introduced. A droplet manipulation scheme where the droplets are merged, oscillated, and mixed is presented. Finally, numerical models and formulations are established.
Droplet Manipulation Schemes
The manipulation of droplets in our study is based on the EWOD principle, as illustrated in Figure 1. The system comprises a dielectric layer, patterned electrodes, and a hydrophobic surface. A droplet, initially at rest with a contact angle , is placed on this surface, bridging two electrodes. The application of a voltage to an electrode induces electrowetting, reducing the contact angle to as described by the Young-Lippmann equation (Equation 1).
FIGURE 1
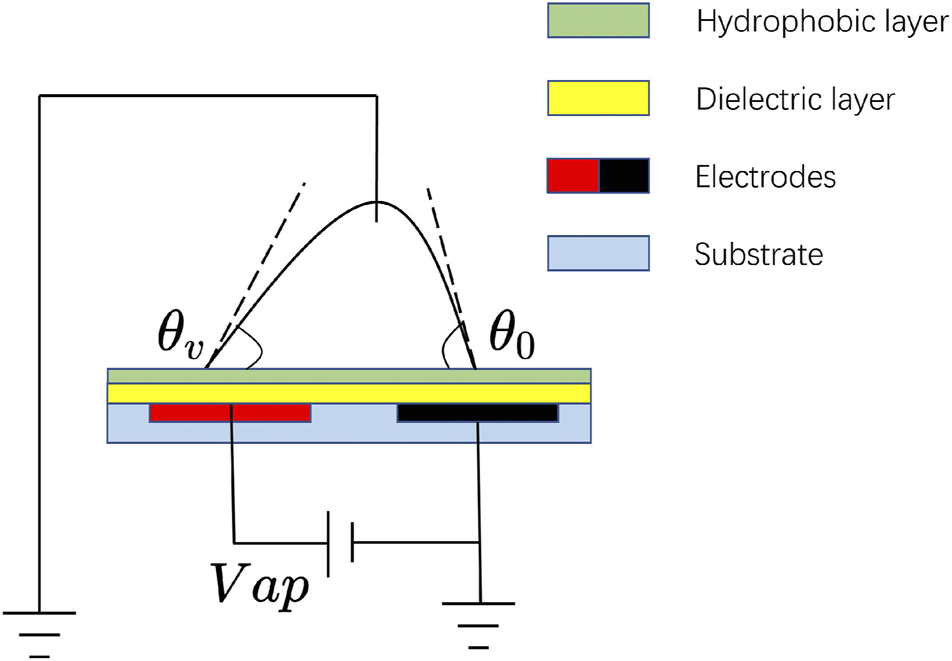
The schematic diagram of an open EWOD digital microfluidic system.
Where represents the liquid-gas surface tension coefficient, denotes the dielectric layer’s capacitance per unit area. A pressure gradient induced by propels the droplet towards the right. EWOD effect enables droplet transport by altering the contact angle, with the driving frequency corresponding to half the frequency of the applied AC voltage, . Basic operations include transport, coalescence, division, and dispensing, typically managed through a two-dimensional electrode array [30]. Figure 2 outlines the electrode actuation scheme for droplet merging. Initially, droplets 1 and 2, with and without dye, respectively, are positioned at the interface of electrodes 1-2 and 3-4 [Figure 2A]. Activation of electrodes 2 and 3 at s induces electrowetting effect, causing the droplets to merge into droplet 3 [Figures 2B, C].
FIGURE 2
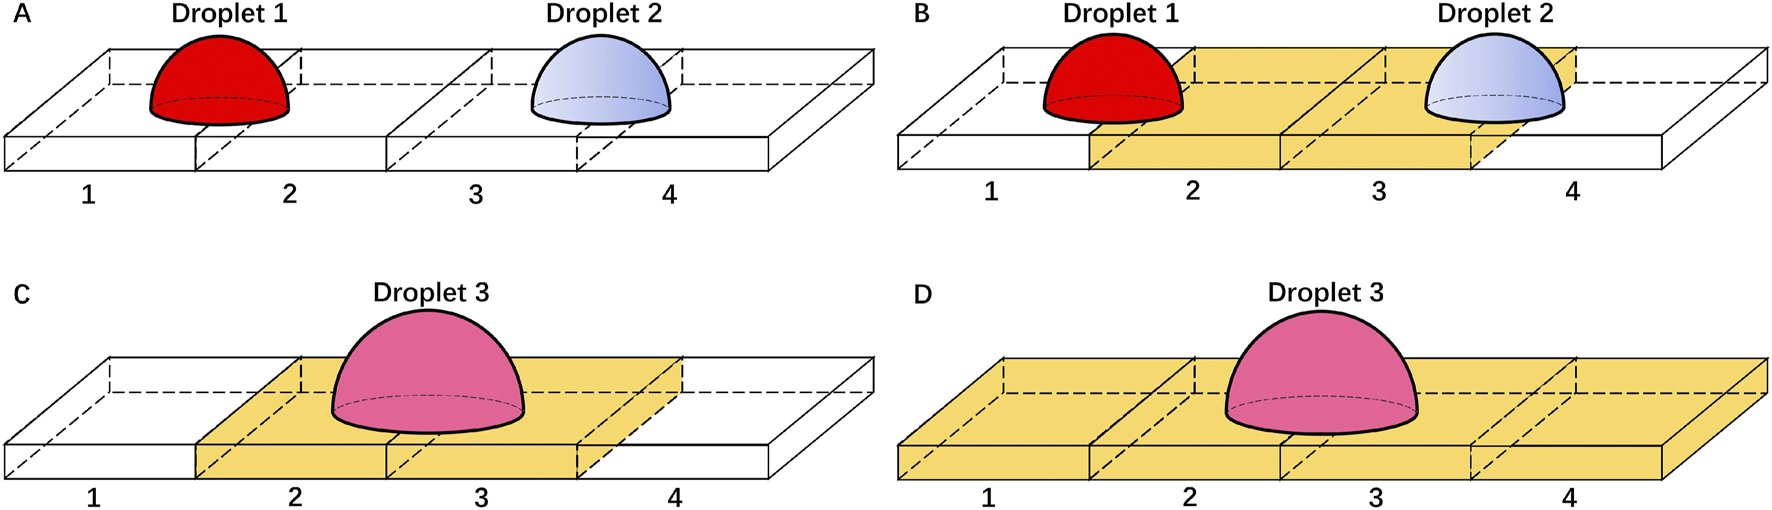
The electrode actuation scheme for droplet merging. Droplet 1 is filled with dye and droplet 2 is not. The voltages for the white electrode and the yellow electrode are 0 and , respectively. (A) initial state, (B), (C) droplet 1 and droplet 2 are merged into droplet 3, and (D), all the electrodes are on, and the droplet 3 oscillates freely.
Before applying AC voltage to the droplet, some prepatory work are done. At , all the electrodes are activated to smear out the influence of electrode 1 and 4 on the merged droplet’s motion, as shown in Figure 2D. The droplet oscillates under a uniform electric field due to inertia. At , the droplet has been fully merged and the natural oscillation amplitude has been dissipated a lot. At this time, apply AC voltage to all the electrodes. As a result, the contact angle constantly changes according to Equation 1, and the droplet mixes with oscillation. Scaled by the capillary timescale , the two nondimensionalized critical time and are set as 2.05 and 24.81, respectively.
For the simulation, the electrowetting effect is modeled by periodically varying the contact angle according to Equation 2, where and represent the maximum and minimum contact angles, respectively.
This approach simplifies the numerical simulation by replacing the complex electrowetting dynamics with a sinusoidal variation of the contact angle [27, 31].
Numerical Modeling and Interface Tracking
The numerical modeling of the incompressible microfluidic flow in this study is based on the Navier-Stokes (NS) equations, which are given by Equation 3 for the momentum conservation and Equation 4 for the incompressibility condition.
Where is the density, is the velocity, is the pressure, is the surface tension, is the gravitational acceleration, and is time. The water droplet dimensions are on millimeter scale, resulting in a Bond number, , less than unity, where is the droplet’s characteristic length scale. Thus, gravitational forces in Equation 3 are neglected [32].
The phase-field method is employed to track the dynamic interface of the droplet. The phase-field variable and its chemical potential are introduced to replace the surface tension term in Equation 3 with , as shown in Equation 5. The Cahn-Hilliard equation governs the evolution of and ensures that it assumes values of −1 or 1, except in a thin region at the fluid-fluid interface, as shown in Equation 6, where is the diffusion parameter, called the mobility:
The mass equation, given by Equation 7, is used to calculate the dye concentration within the droplets, where is the concentration of the solute, is the diffusivity, and is the reaction rate. The equation describes the transport of solute within the merged droplet, where the initial concentration in one droplet is and in the other is 0. The solute spreads until the concentration is uniform throughout the merged droplet. The reaction rate is set to 0 in this study.
Computational Setup and Validation
Figure 3 presents the schematic of the computational domain, where two identical droplets are centrally located on electrodes 1 and 2, and electrodes 3 and 4, respectively. The red and blue droplets refer to droplet with and without dye, respectively. The droplets consist of water, with their physical properties listed in Table 1. The initial droplets are hemispheres with a radius of . The domain size is non-dimensionalized based on the initial droplet radius , which serves as the reference length scale; the corresponding geometrical parameters are detailed in Table 2.
FIGURE 3
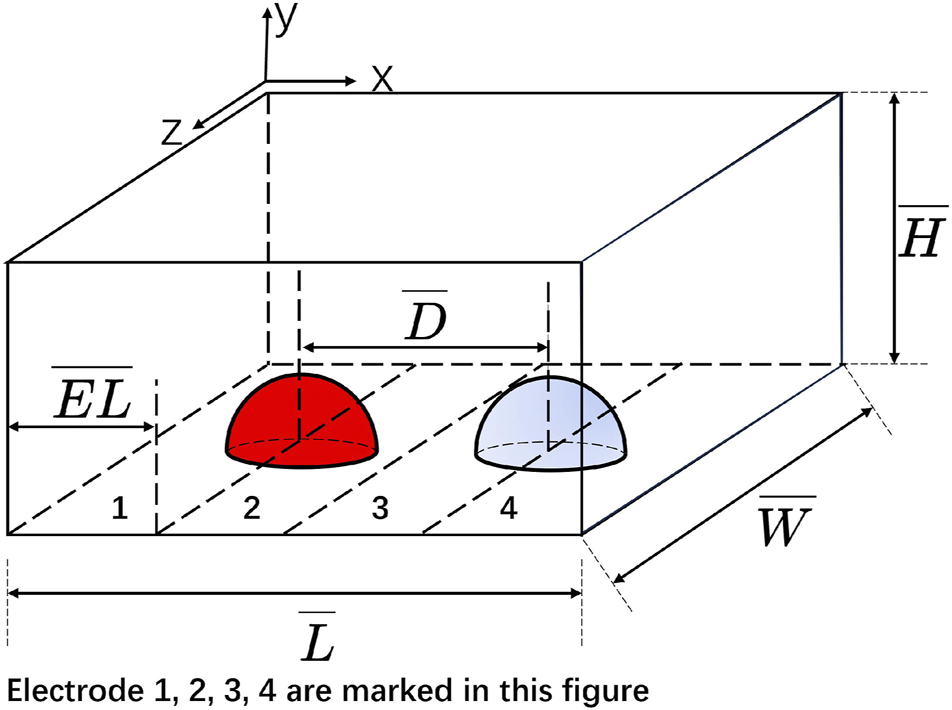
An illustration of the computational domain.
TABLE 1
| Property | Definition | Value | Unit |
|---|---|---|---|
| Dynamic viscosity | |||
| Density | 996.93 | ||
| Surface tension coefficient | 0.0728 | ||
| Initial contact angle | 90 | deg | |
| Minimum contact angle | Depends on the scheme | deg | |
| Maximum contact angle | Depends on the scheme | deg | |
| Initial radius of the two droplets | Depends on the scheme | mm | |
| Initial concentration of the dyed droplet | 5 | ||
| Diffusivity of dye |
The physical properties of the droplet.
TABLE 2
| Property | Definition | Value |
|---|---|---|
| Nondimensional length of the computational domain | 8 | |
| Nondimensional width of the computational domain | 8 | |
| Nondimensional height of the computational domain | 3.6 | |
| Nondimensional initial distance between the center of the two droplets | 3 | |
| Nondimensional length of the electrode in the x-direction | 1.5 |
The nondimensional geometrical parameters of the computational domain.
Adaptive mesh refinement, known to optimize computational efficiency and accuracy for transient flows, is employed with a two-level approach. The simulation utilizes a uniform square mesh with a base grid spacing of /5, determined by a grid refinement study. Near the droplet interface, the mesh is refined to 1/4 of the base grid spacing. Boundary conditions include a Navier slip at the domain bottom and no-slip conditions at the top and sides.
To ensure numerical stability across capillarity, viscosity, and Courant criteria, the time step is dynamically adjusted [33]. Mesh independence is confirmed by simulating with mesh sizes of , , and near the interface for 0˜0.009 s for Case R1.12-60-90. Detailed mesh independence study can be found in our previous work [27]. Finally, a mesh size of near the interface is chosen and implemented in all the simulations.
Results and Discussion
This study mainly focuses on the oscillation of the merged droplet. Hence, the simulated merging process is not presented. The onset of parametric instability within the droplet initiates lateral and vertical wave formation, leading to a star-shaped oscillatory pattern and surface undulations. This phenomenon has been investigated in several researches [34–39]. Research on initiating parametric oscillations within micro-droplets in electrowetting-on-dielectric (EWOD) microfluidic systems has been documented in the literature [24, 40]. Bansal et al. have induced parametric oscillation in coalesced droplets, which markedly enhances the mixing efficiency and slashes the diffusive mixing time by as much as 98% [24]. The oscillatory behavior of the droplet’s shape gives rise to distinct flow patterns, which merit further elaboration. The flow dynamics are examined numerically and compared with existing literature to ascertain the accuracy of the findings. Furthermore, the study presents and contrasts the vortices and shear rate distributions in the presence and absence of oscillations, thereby elucidating the flow dynamics induced by electrowetting-driven oscillations.
Multiple cases are studied to ensure the validity of our results. The cases studied here are listed in Table 3 and referred to by their names in the following paragraphs for simplicity. The name of the case refers to its initial radius of the two droplets , maximum contact angle , and minimum contact angle .
TABLE 3
| Name | |||
|---|---|---|---|
| Case R2-30-60 | 2 | 60 | 30 |
| Case R1.34-30-60 | 1.34 | 60 | 30 |
| Case R2-40-80 | 2 | 80 | 40 |
| Case R2-60-90 | 2 | 90 | 60 |
| Case R1.12-60-90 | 1.12 | 90 | 60 |
The cases used in the study. The name of the case refers to its initial radius of the two droplets , maximum contact angle , and minimum contact angle .
To enhance clarity in the presentation of results, certain data have been rendered dimensionless. This normalization can be discerned by noting the presence of horizontal lines above the respective data headers, for example, represents the scaled horizontal coordinate. Unless otherwise specified, length-related parameters are scaled using , time parameters are scaled using the capillary timescale , and frequency-related parameters are scaled using .
Parametric Oscillation
By subjecting the droplet to a driving frequency that is twice its resonance frequency under enough amplitude, parametric instability can be triggered in droplet. The oscillation mode number is marked as . One characteristic of the parametric instability is the periodic lateral wave that appear in the azimuthal direction of the droplet. Figure 4F is a bottom view of the droplet, where the droplet radius can be regarded as a superposition of the equatorial radius and the lateral disturbance .
FIGURE 4
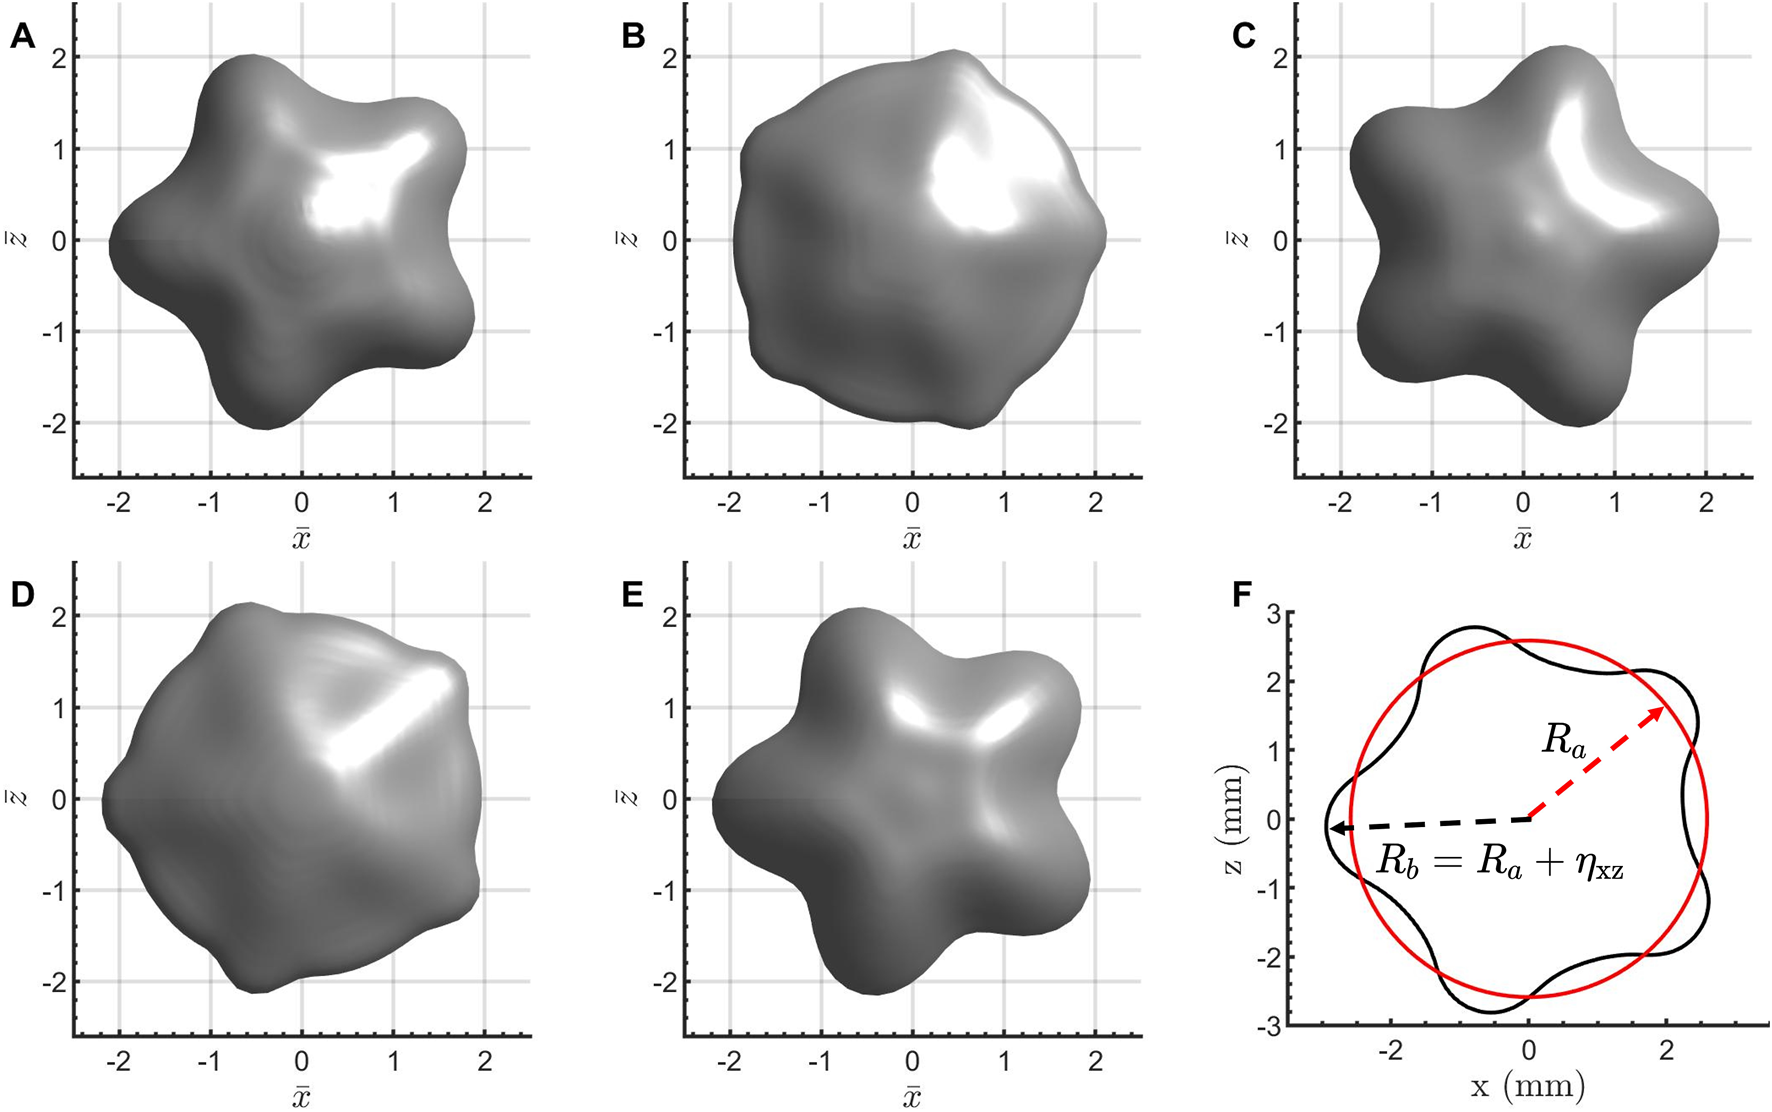
A cycle of the parametrically oscillating droplet at mode, taking Case R1.34-30-60, mode as an example. The phase of each droplet in a cycle is: (A), (B), (C), (D), (E), where refers to a period of the droplet oscillation. (F) is the bottom view of the droplet, showing that the droplet radius Rb can be decomposed into Ra and ηxz.
The theoretical resonance frequency of the sessile droplet can be estimated according to Equations 8, 9:
Where is the angular resonance frequency, is the surface tension coefficient, is the density of the droplet, is the time-varying equatorial radius, is the mode number, and is the modification parameter, which ranges from 0.7 to 1 in our study. The mode number also implicates the number of lobes that appears in the star-shaped droplet. Up to eight modes of parametric oscillations are founded in this study.
The temporal evolution of the lateral wave is depicted in Figure 4, aligning closely with previously published findings [37, 38]. The oscillation period is identified as . The moment at which the droplet achieves its most star-like form is designated as and is considered the onset of the cycle, as illustrated in Figure 4A. Subsequently, the star-shaped droplet initiates the process of contracting its elongated lobes while elongating its shorter lobes. Over time, the droplet’s base transforms into a spherical shape, with the lateral wave reaching zero amplitude, as shown in Figure 4B at . The previous short and long lobes continue their respective processes of elongation and contraction, culminating in a star droplet that is the inverse of its initial state, as depicted in Figure 4C. For the sake of clarity, the initial star droplet configuration is referred to as , while the droplet’s configuration at is designated as . Between and , the droplet undergoes a symmetrical shape transformation, ultimately reverting to the configuration, as shown in Figures 4D, E.
Calculation of the Most Star-Like Moment for Droplet
The instant at which the droplet reaches its most pronounced star-shaped form is denoted as , serving as a reference for identifying the full oscillation cycle of the star-shaped droplet. As the droplet undergoes continuous changes in its equatorial radius , a modified measure of standard deviation, denoted , is proposed for the determination of , as outlined in Equation 10. Here, the standard deviation is normalized by the equatorial radius . This normalization serves to remove the variability caused by the changing . The adjusted standard deviation quantifies the deviation of the droplet from a spherical shape, with corresponding to the peak value of . To calculate , data from the droplet’s stable oscillatory state are utilized, with is identified at the points of local maxima.
Flow Analysis
The parametric oscillation brings about not only shape changes, but also characteristic internal flow patterns, which will be discussed in the following paragraphs.
Validation
The internal flow in parametrically oscillating star-shaped droplet can be assumed as potential flow [41]. The radial internal flow velocity in the bottom of the droplet can be expressed as follows:
In Equation 11, represents the peak fluid velocity observed at the equatorial periphery as the droplet returns to its equilibrium form. Additionally, denotes the radial distance from the droplet’s center, while specifies the azimuthal angle.
The distribution of the radial velocity at the base of the droplet is illustrated in Figure 5A. Here, the droplet is in the phase, and the radial velocity exhibits a sinusoidal pattern around its circumference, characterized by the presence of eight wave crests. Figure 5B depicts the variation of the measured radial velocity as a function of the azimuthal angle. The sinusoidal nature of the curve and the number of crests are in excellent agreement with the predictions of Equation 11, confirming that the flow dynamics observed in this study are consistent with the potential flow theory proposed in the literature [41] for parametric oscillations of droplets. The streamlines at the bottom of the droplet for Case R2-60-90, with a driving frequency of Hz and at the mode, are presented in Figure 6. This figure reveals a strong correlation with the experimental particle trace observations reported in the literature [41] for droplets undergoing parametric oscillations at the mode.
FIGURE 5
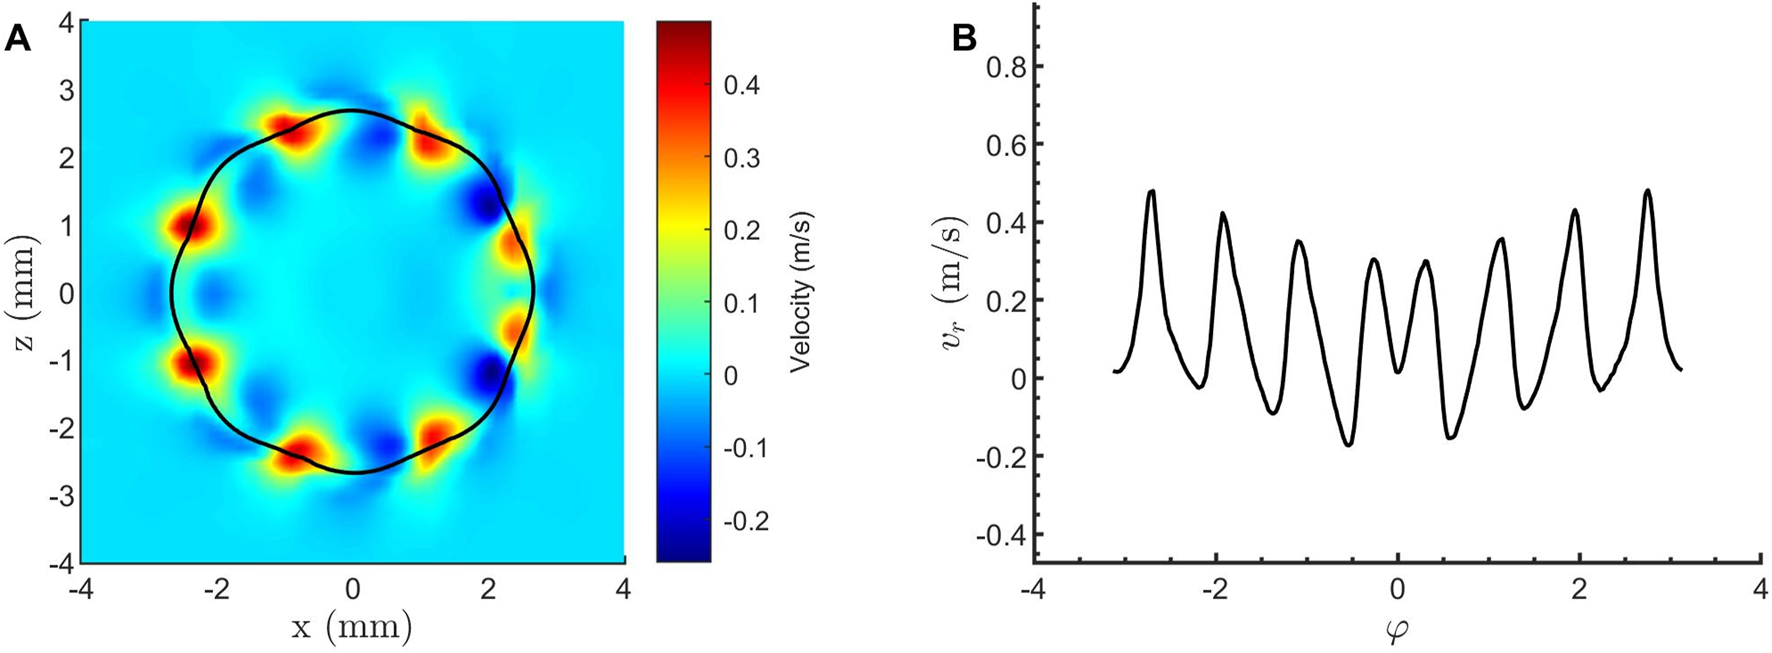
Radial velocity distributions for a droplet oscillating in the mode at the phase for Case R1.34-30-60 with a driving frequency of Hz. (A) Radial velocity distribution at the droplet’s base. (B) Radial velocity at the droplet’s equatorial edge.
FIGURE 6
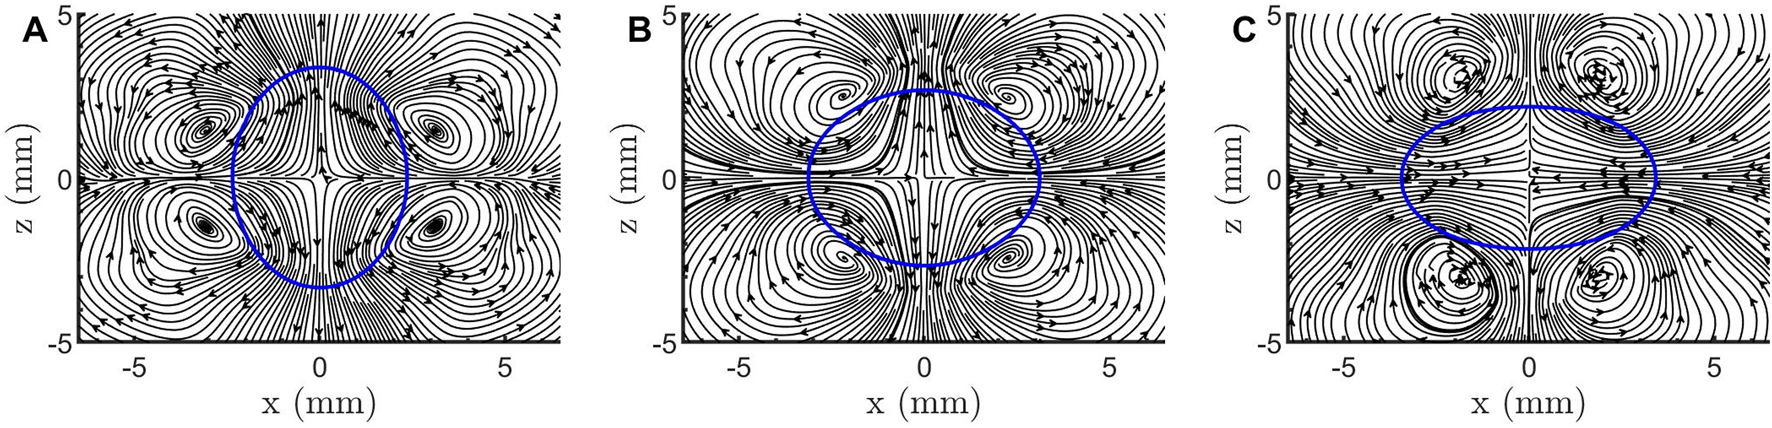
Streamline patterns at the base of the droplet for Case R2-60-90 in the mode at a driving frequency of Hz. The depicted phases of the droplet within its oscillation cycle are: (A), (B), and (C), with denoting the oscillation period of the droplet.
Vortex and Shear Rate Analysis
The internal flow in the droplet includes flows in two directions, the up-down direction and the azimuthal direction, which can be seen by the streamlines in the x-y plane and x-z plane, respectively. The streamlines radiating from the center in Figure 7B correspond to the droplet’s flow at the bottom center reflected in Figure 7A. Therefore, this part of the streamlines in Figure 7B is not connected to the streamlines at the edge of the droplet, exhibiting a discontinuous pattern.
FIGURE 7
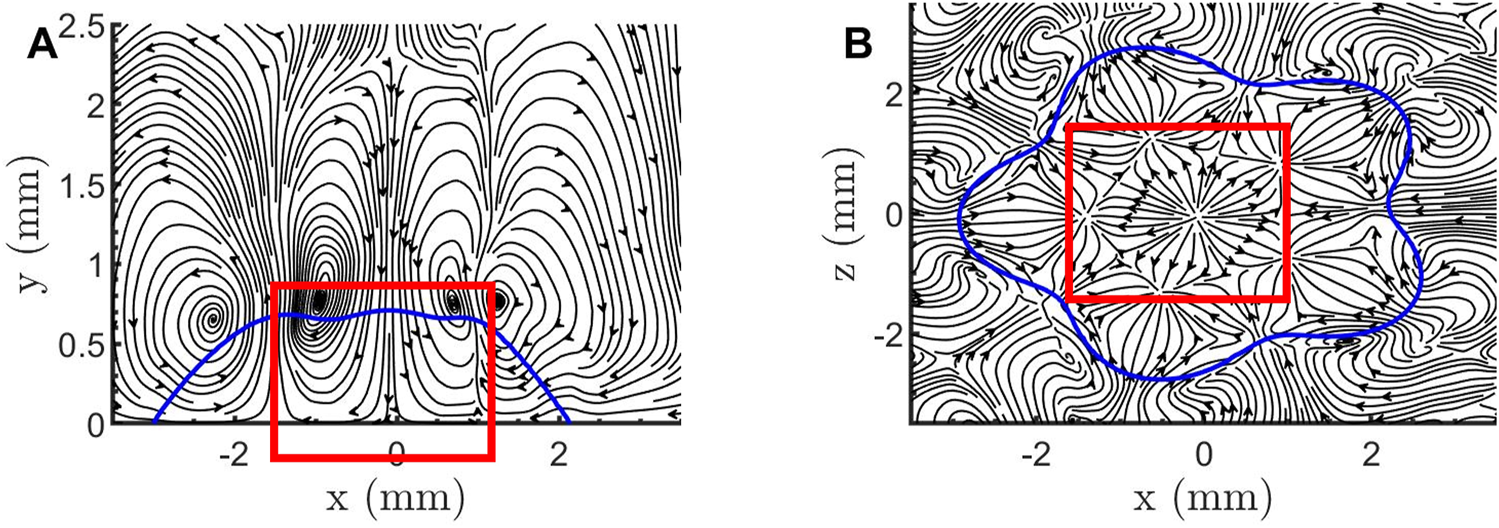
Streamlines in Case R1.34-30-60, mode, for (A) x-y plane, (B) x-z plane.
Cases excited with parametric oscillation show higher vorticity magnitude and shear rate than cases with no actuated oscillation and no parametric oscillation, as shown in Figure 8. Case R2-40-80 display mode parametric oscillation at Hz, and display no parametric oscillation mode at Hz, whose driving frequency is close to Hz. The former case shows stronger vorticity and shear rate than the later in the liquid-gas interface of the droplet [Figures 8A, C, D, F]. This may due to the higher oscillation amplitude brought about by the resonance mode, which also explains why Case R2-40-80 show higher vorticity and shear rate than cases with no actuated oscillation [Figures 8A, B, D, E].
FIGURE 8
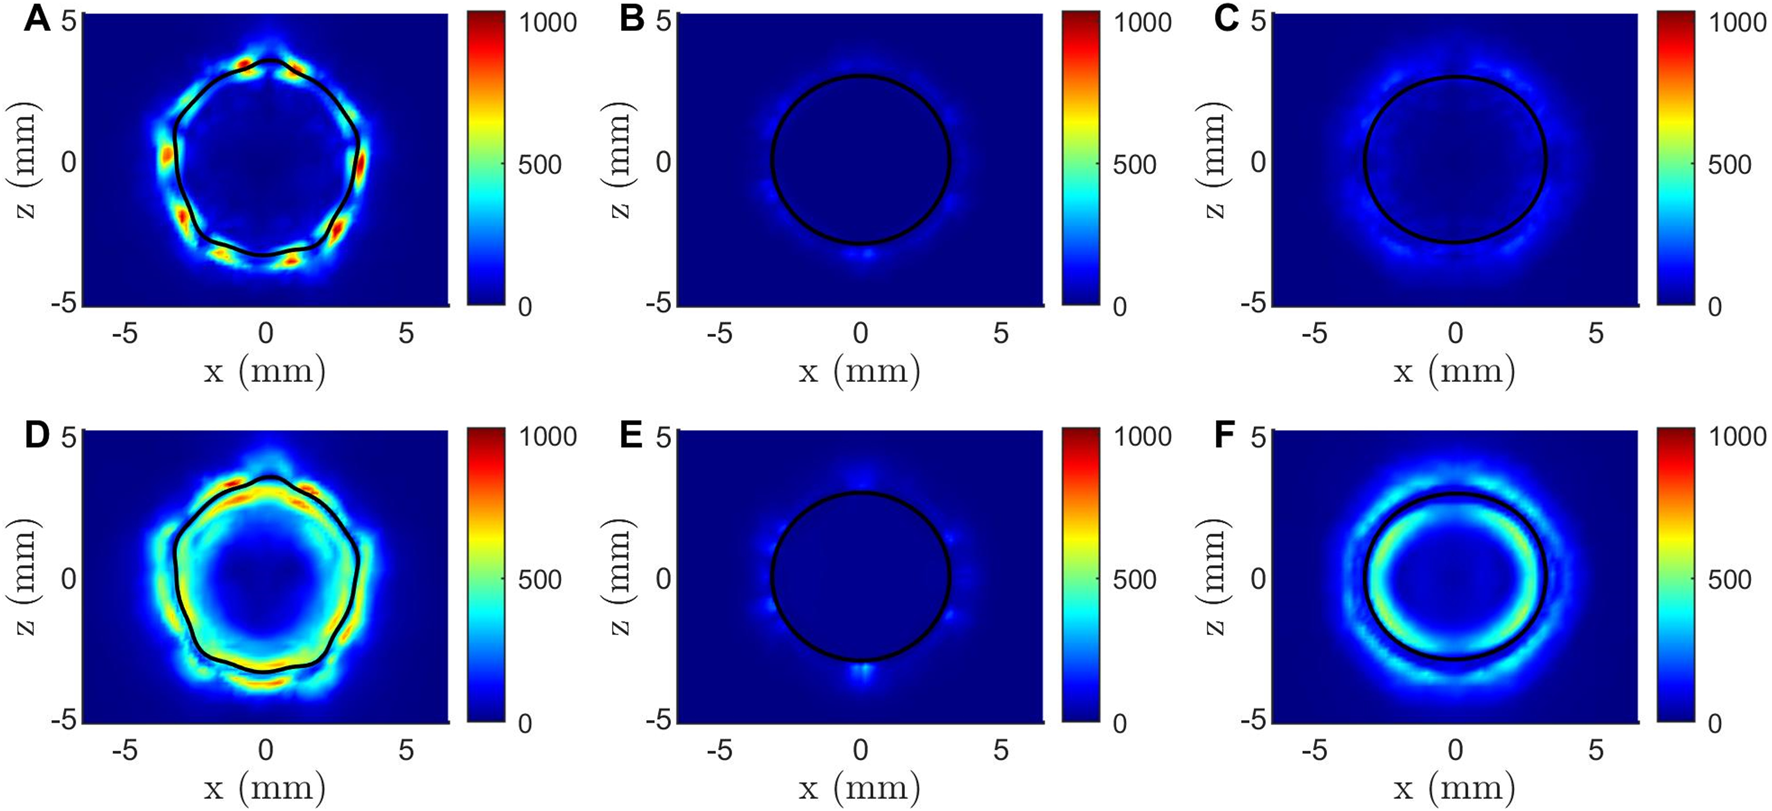
Vorticity magnitude (top row) and shear rate (bottom row) distributions at the droplet’s base for different experimental conditions. (A, D) Case R2-40-80 with mode excited at Hz; (B, E) Case R2 of free oscillation; (C, F) Case R2-40-80 with no parametric oscillation mode, excited at Hz.
Also, the distribution of the vortices and shear rate is worth studying. The vortices rarely appears inside the droplet, owing to the laminar nature of the micro-droplet. Nevertheless, there are still strong vortices near the liquid-gas interface of the droplet, most of which are distributed around the intersections of its lobes. This rule applies to all parametric oscillation cases studied here, as shown in Figures 9A∼F. In the bottom plate, the temporal change of contact angle result in intense velocity gradient in the liquid air interface, [Figure 5] which may cause rotations of the fluid microelements and generate vortices around the liquid-gas interface. Considering to when the previous short and long lobes continue their respective processes of elongation and contraction [Figures 4B, C], the velocity directions of two adjacent lobes are opposite to each other. Therefore, the velocity gradient at the intersection of two adjacent lobes is the greatest, which explains why the vorticity magnitude is mainly concentrated at these intersections. The shear rate are mainly located near and inside the liquid-gas interface [Figures 10A∼F]. This can also be explained by the extension and retraction of the droplet brought about by the parametric oscillation. Due to the change in the curvature of the droplet, the interfacial tension generates an inward or outward pressure, resulting in stronger shear rate within the droplet.
FIGURE 9
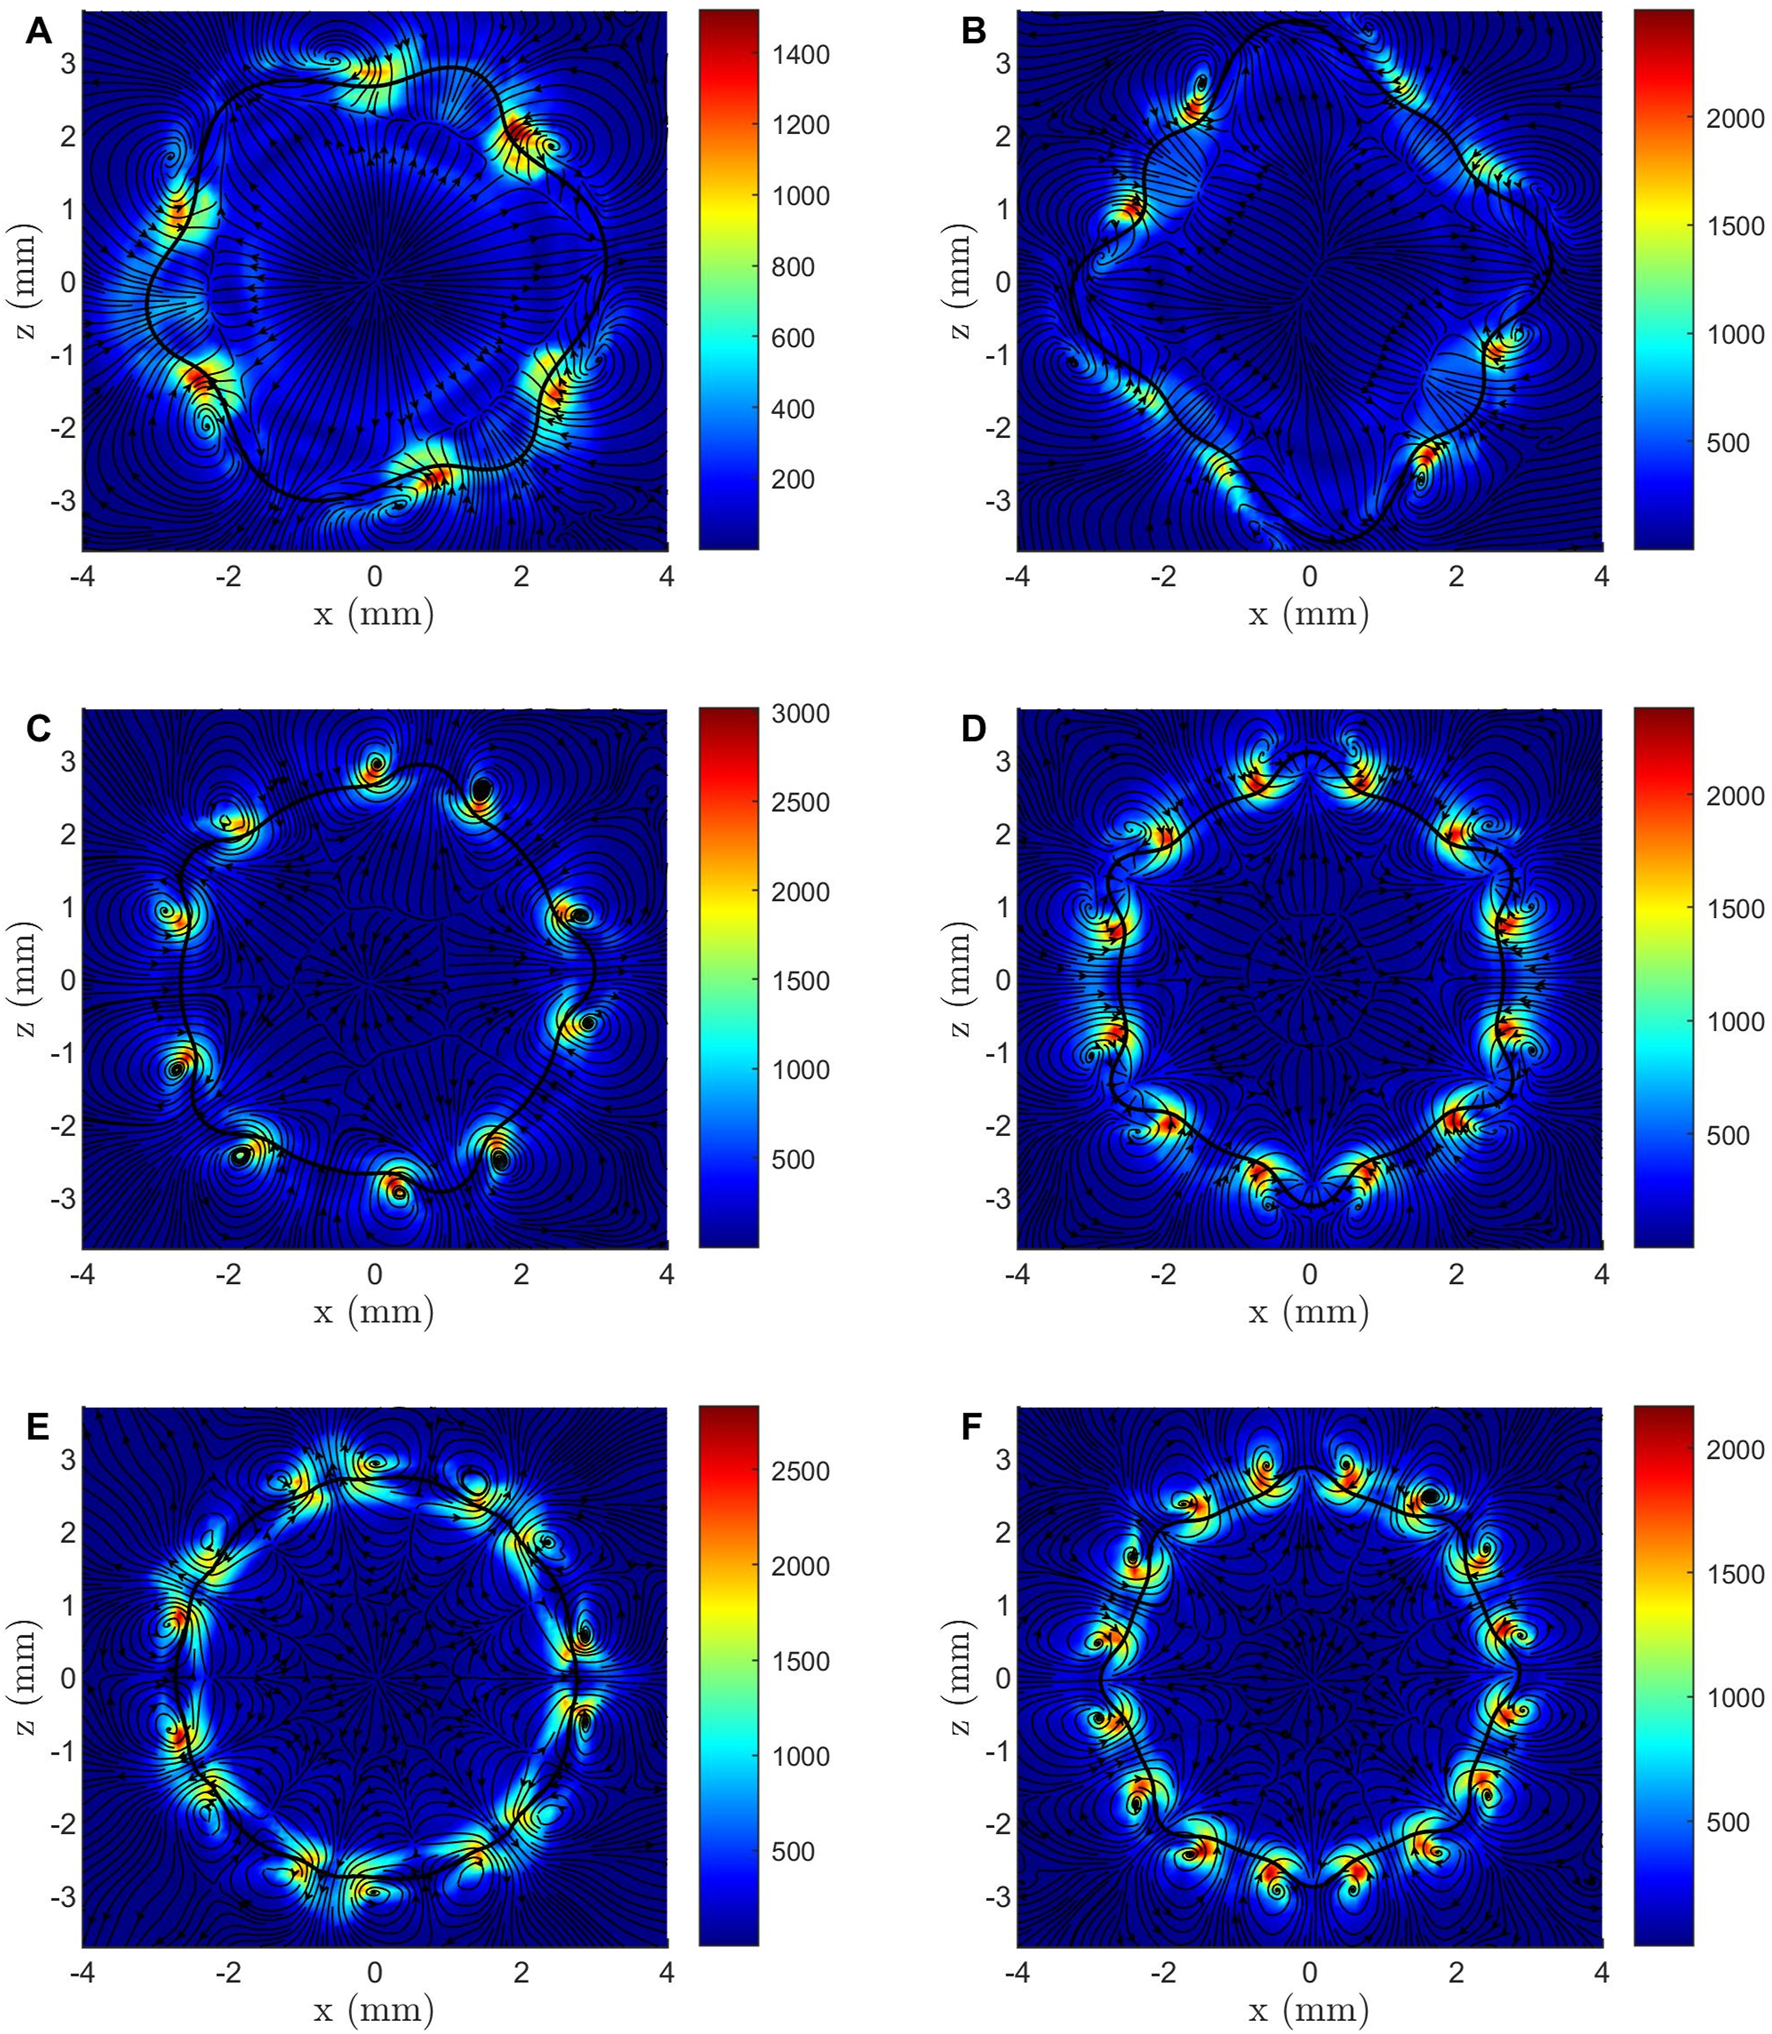
Vorticity magnitude distribution in Case R1.34-30-60 for (A) mode, (B) mode, (C) mode, (D) mode, (E) mode, (F) mode.
FIGURE 10
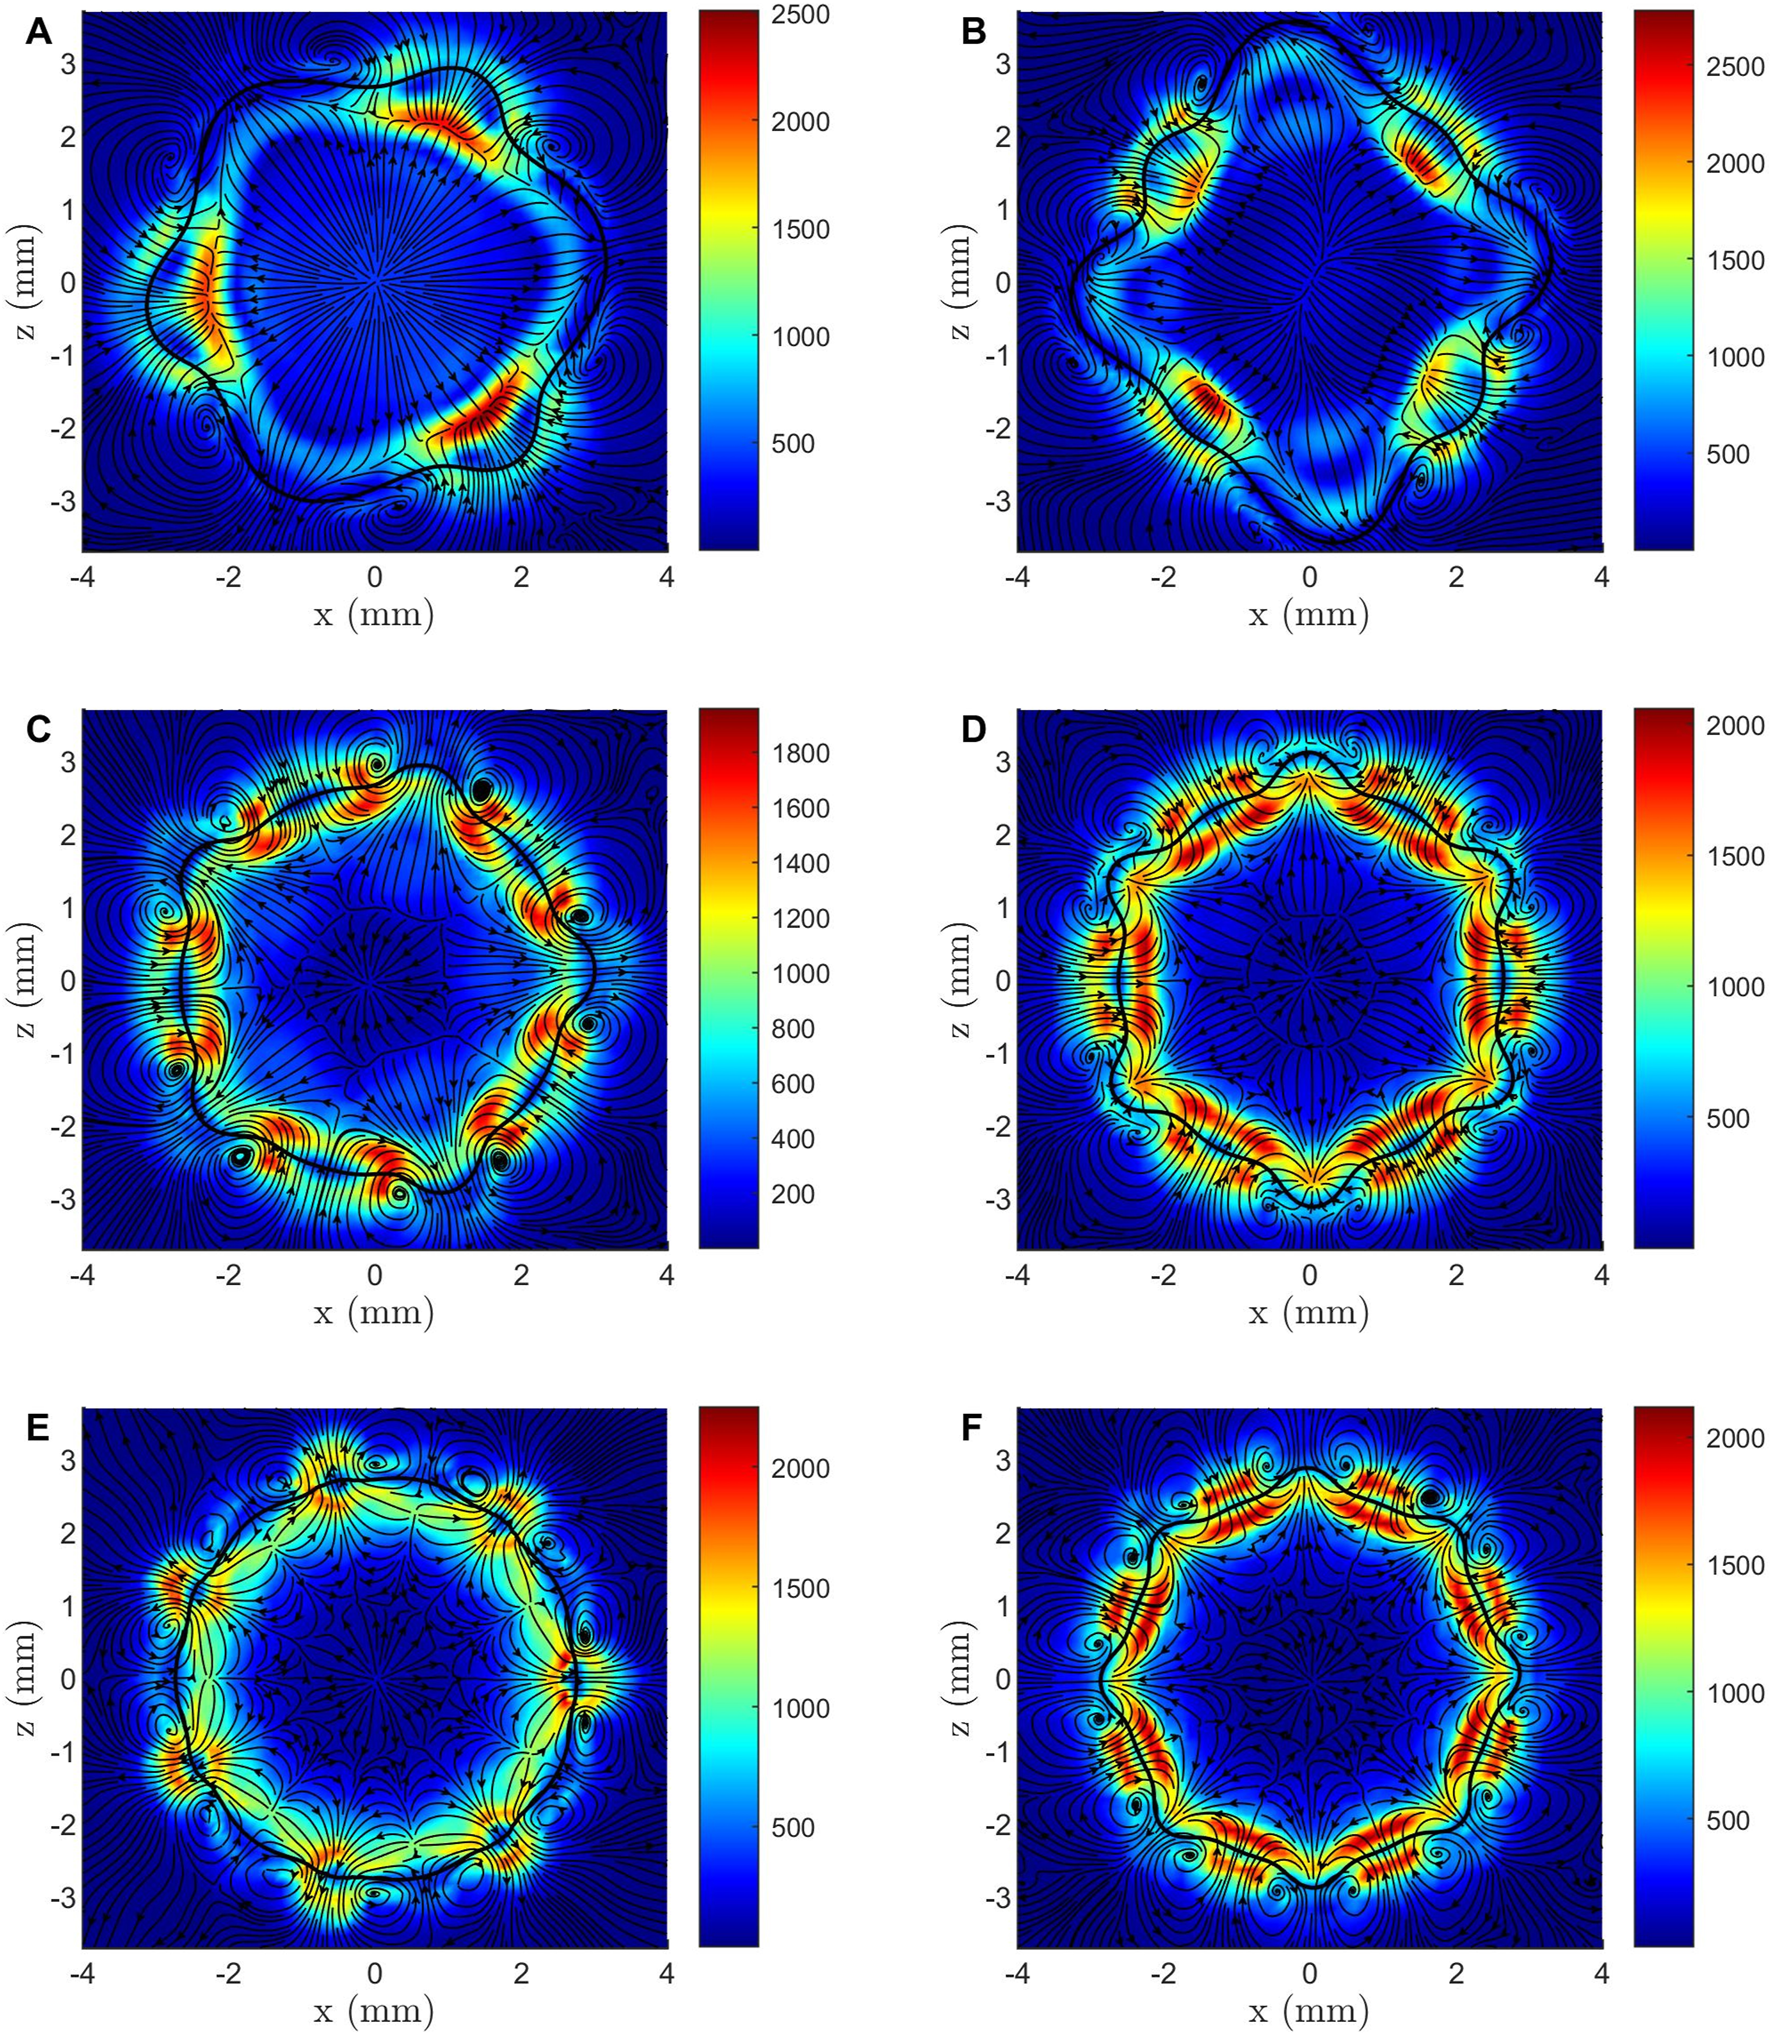
Shear rate magnitude distribution in Case R1.34-30-60 for (A) mode, (B) mode, (C) mode, (D) mode, (E) mode, (F) mode.
The Mixing Process
In this section, the impact of the parametric oscillation on the mixing process is analyzed. We studied the dye distribution in droplets and defined the mixing index by scaling the variance of the chemical concentrations in the transient regime [27, 42] as shown in Equations 12, 13:
Where corresponds to the amounts of molecules in the volume, and is the mean concentration. The mixing index ranging from 0 to 1 represents the mixing efficiency, and reaches 1 when the dye in the droplet is fully mixed.
Mixing Enhancement Achieved by Parametric Oscillation
At , the droplet is almost mixed for Case R2-30-60 and Case R1.34-30-60, and the corresponding mixing index is marked as . Cases where droplet is not applied with AC voltage and oscillates freely are denoted as free oscillation. The mixing efficiency of the AC voltage-actuated oscillation cases and the free oscillation cases are compared by checking their mixing index at , as shown in Figure 11. The cases with AC voltage-actuated oscillation show better mixing efficiency than the cases of free oscillation, which is in good agreement with previous numerical and experimental studies [19, 21, 24, 27]. Hence, the parametric oscillation actuated by the AC voltage can be applied to enhance mixing in micro-droplet. It has been mentioned in Vortex and Shear Rate Analysis that the vorticity magnitude and shear rate in parametric oscillation cases are higher than that in free oscillation cases. The vortices mainly distribute around the liquid-gas interface of the droplet, accelerating the mass transfer near the interface, and hence attribute to the overall increase of the mixing index. The shear rate distributed near and inside the liquid-gas interface can lead to the stretching and compression of fluid micro-elements, thereby disrupting the laminar structure within the fluid and promoting the mixing between different components. In summary, compared to free oscillation cases, parametric oscillation brings about higher vorticity magnitude and shear rate near the droplet liquid-gas interface, which enhances the mixing efficiency.
FIGURE 11
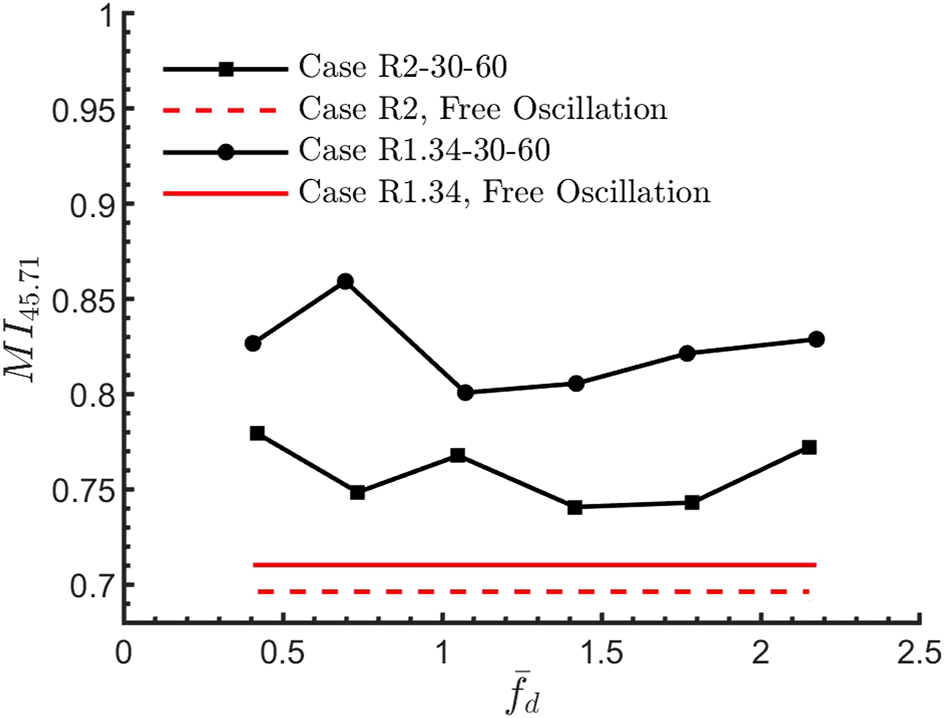
The mixing index at for Case R2-30-60, Case R1.34-30-60, and their corresponding free oscillation cases. Free oscillation refers to the cases where the droplet is not applied with AC voltage and oscillates freely.
The Mixing Index Fluctuation
Besides the mixing enhancement, the parametric oscillation also introduces fluctuations in the mixing index curve, as shown in Figure 12A. The parametric mode is excited at for Case R2-60-90, which are denoted as resonance in Figure 12A. The parametric mode case show fluctuation in the curve, while the free oscillation and no resonance cases do not. This rule applies to all cases computed in this study. The original curve was processed to obtain a smoothed version using the locally weighted scatter plot smooth method implemented in MATLAB. This smoothing procedure allowed for the extraction of the fluctuation patterns from the original curve, thereby providing a method to quantify the fluctuations introduced by the parametric oscillation. The fluctuations in curve are referred to as in the following text.
FIGURE 12
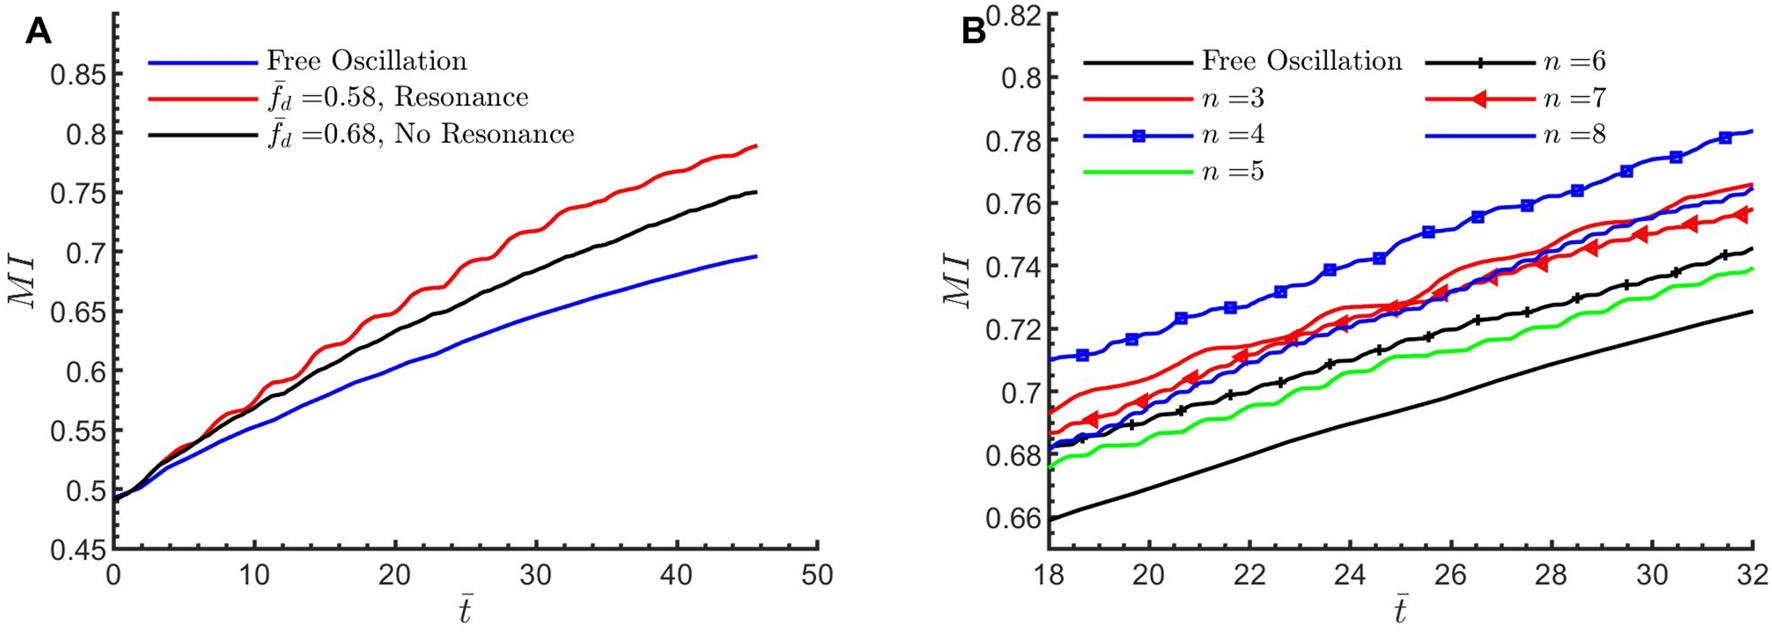
Time variation of the mixing index for (A) the free oscillation case, the resonance condition with , and the non-resonance condition with . [Case R2-60-90] (B) Case R1.34-30-60 and its corresponding free oscillation case. Note that the presence of parametric oscillation is observed to cause fluctuations in the curve.
The mixing index curves for Case R1.34-30-60 and its corresponding free oscillation case are plotted in Figure 12B. Except the free oscillation case, all parametric oscillation cases show apparent mixing index fluctuations . Applying FFT (Fast-Fourier Transformation) to the mixing index fluctuation , the main fluctuating frequency of show good agreement with its driving frequency , as shown in Figure 13. This finding also validate that the mixing index fluctuation is introduced by the parametric oscillation. The mechanism of how parametric oscillation brings about this mixing index fluctuation is demonstrated by analyzing the dye distribution of the droplet. The dye distribution for Case R1.34-30-60, mode is plotted in Figure 14, with positions of four dye lobes marked from 1 to 4 for further discussion. Dye lobes refer to the lobe shape that appear in the dye distribution, which is different from the lobes used when describing the shape of the star-shaped droplet. Between and , the droplet undergoes a transformation from a spherical to a configuration (Figures 14A–C). This morphological transition leads to the progressive convergence of dye lobes 2 and 3, which are increasingly compressed and eventually coalesce into a unified lobe, as depicted in Figure 14C. Subsequently, during the interval from to , the droplet shifts from a spherical to a shape (Figures 14D–F). In a similar manner, dye lobes 1 and 2 merge into one lobe, while dye lobes 3 and 4 amalgamate into a separate lobe, as illustrated in Figure 14F. According to these procedures, the mixing index may reach local maximum at or since some dyes are compressed into one lobe, which explains the origin of the mixing index fluctuation . The intimate relationship between and the droplet’s shape transformation suggests that the primary oscillation frequency of should be twice that of the parametric oscillation frequency, , which is equivalent to the driving frequency, . This frequency prediction aligns with the Fast Fourier Transform (FFT) results presented in Figure 13. The moment of the most star-like moment, , should also corresponds to the local peak of the mixing index, or the crest of . This is confirmed by Figure 15. Therefore, the proposed mechanism, whereby parametric oscillation induces fluctuations by consolidating dye lobes into a unified shape, is consistent with the FFT characteristics and the correspondence of the curve peaks to .
FIGURE 13
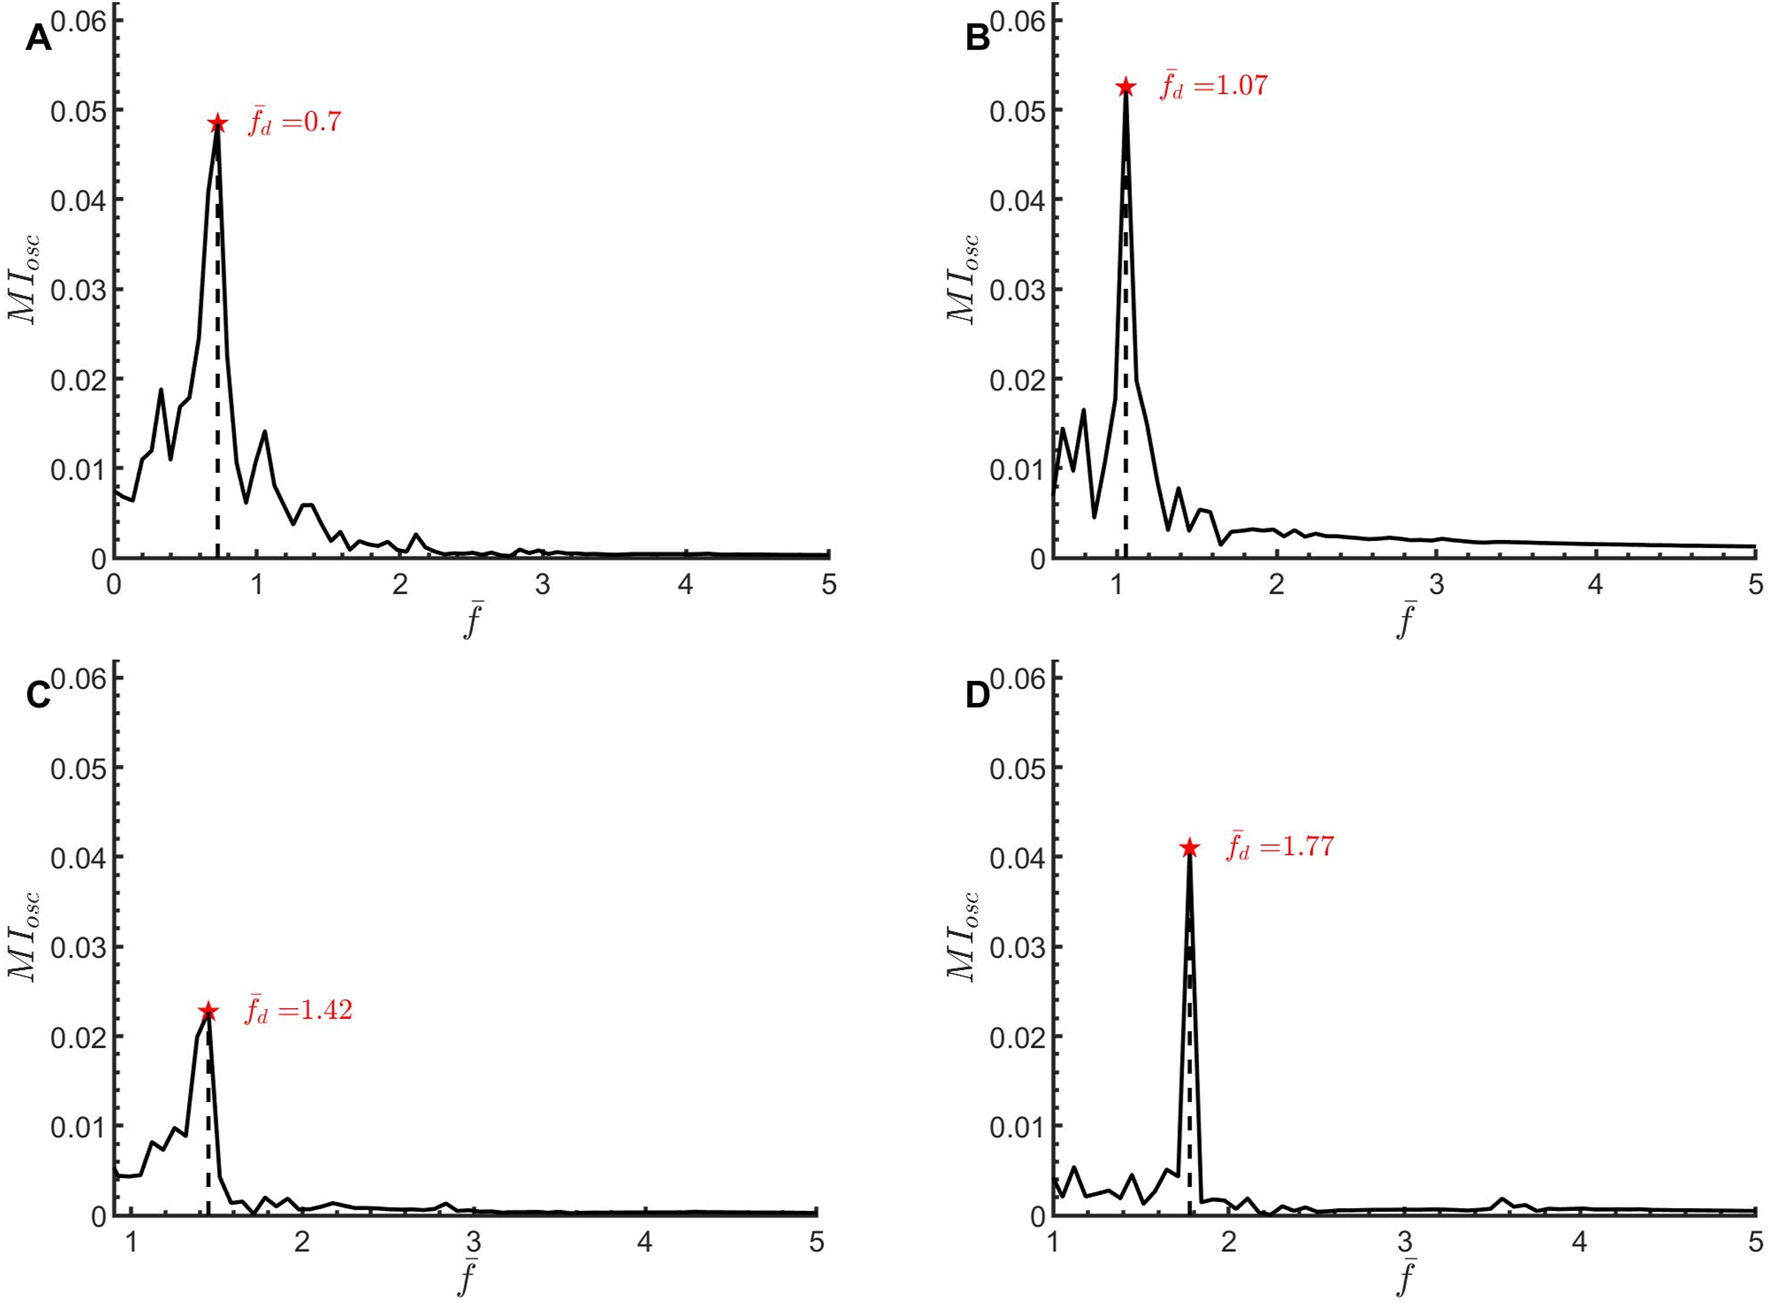
Fast Fourier transform of the mixing index fluctuation in Case R1.34-30-60, for (A) mode, (B) mode, (C) mode, (D) mode, .
FIGURE 14
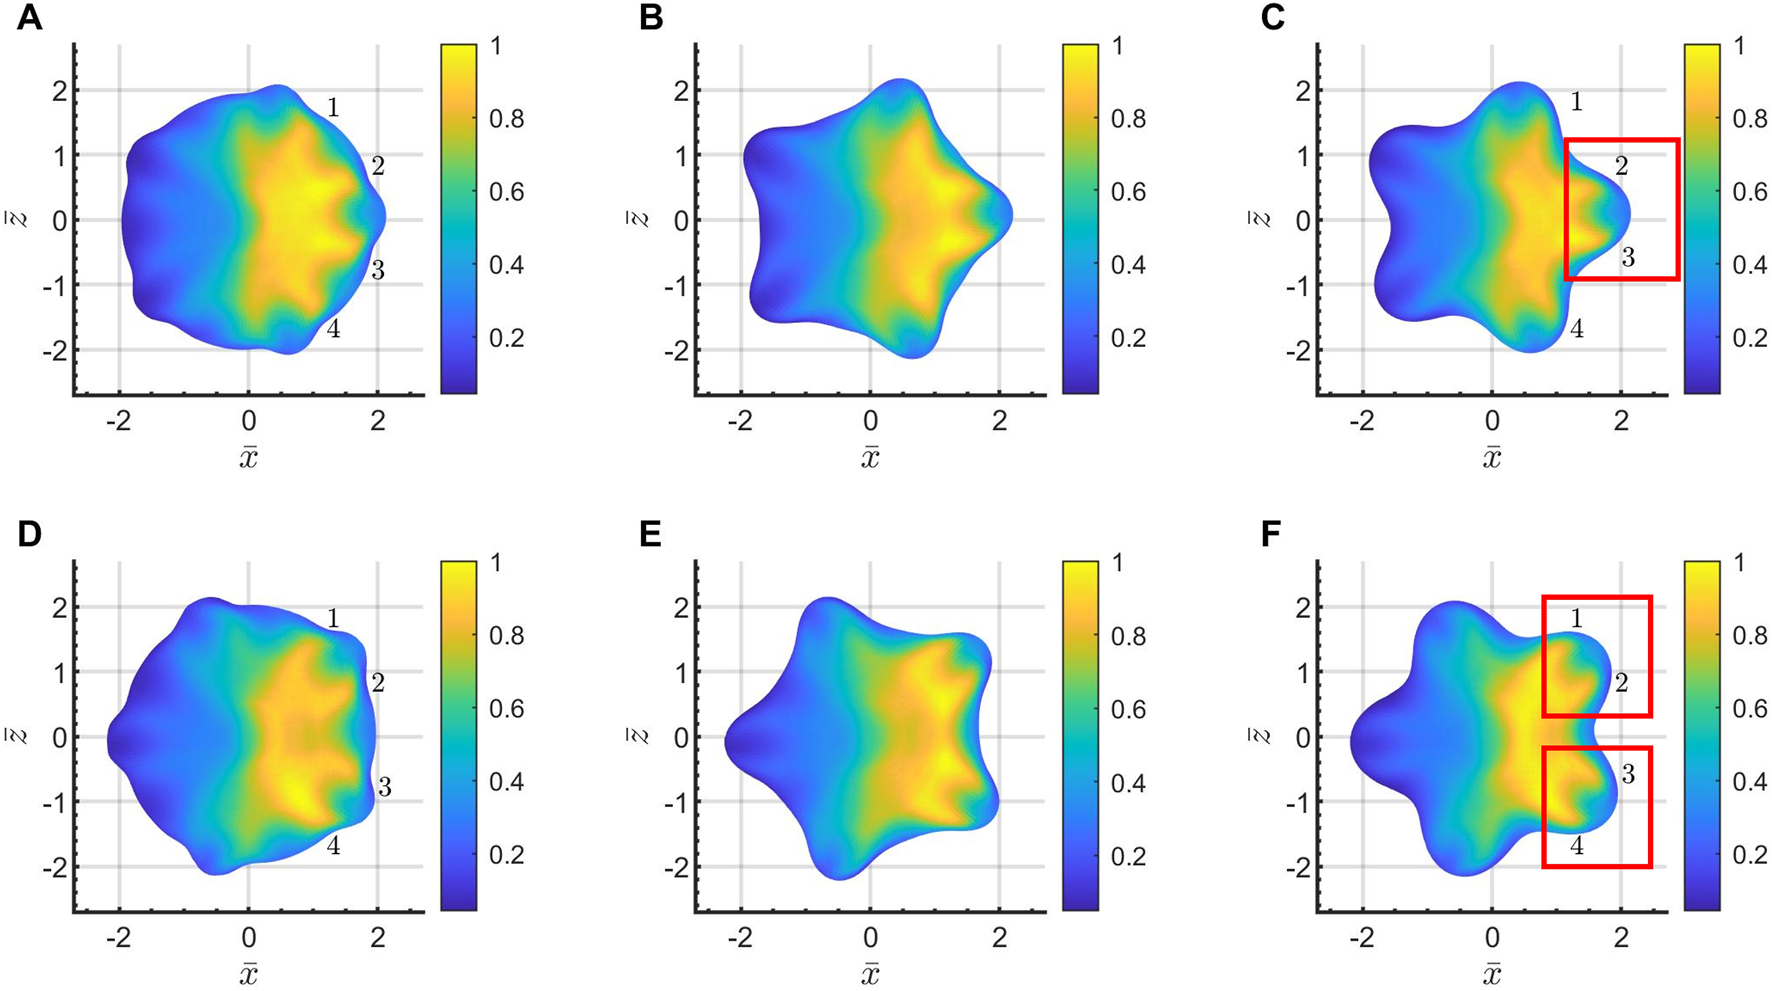
Distribution of the dye concentration for Case R1.34-30-60, mode. For better illustration, the spatiotemporal concentration is normalized by the transient maximum concentration in this figure. Positions for four dye lobes are marked as 1 to 4 for further discussion. (A), (B), (C), (D), (E), (F).
FIGURE 15
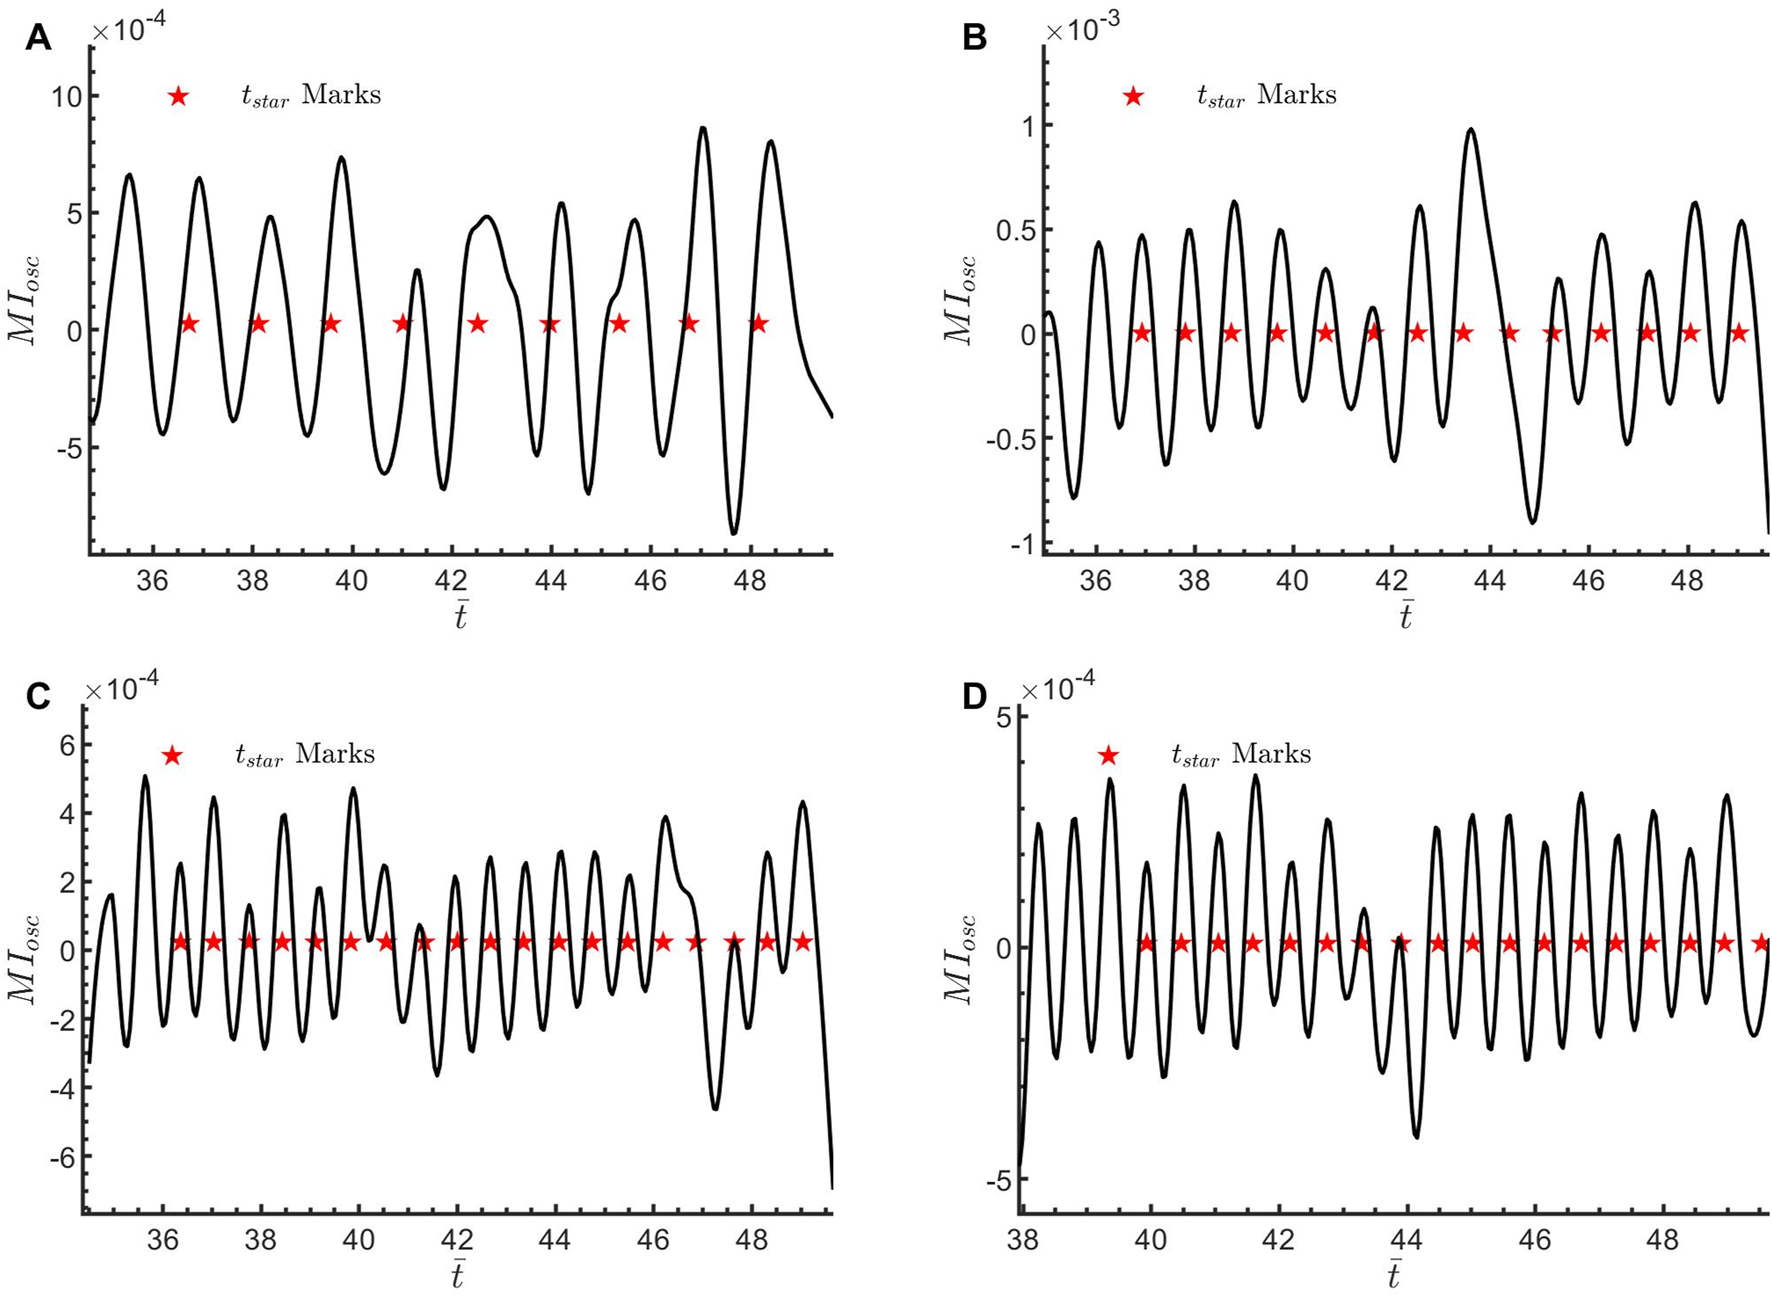
The time variation of the mixing index fluctuation for Case R1.34-30-60: (A) mode, (B) mode, (C) mode, (D) mode. The horizontal coordinates of the star marks correspond to the dimensionless value of the most star-like moment. For a more intuitive representation, the vertical coordinates of the star marks are set as the average of the values from the curve.
Conclusion
This study utilizes numerical simulations to investigate how electrowetting-induced parametric oscillations enhance mixing within a merged micro-droplet in Electrowetting-on-Dielectric (EWOD) microfluidic systems. It replicates a realistic scenario in EWOD digital microfluidics, where two micro-droplets collide head-on and merge, after which an AC voltage is applied to induce oscillations that improve mixing efficiency [15]. These parametric oscillations are intentionally triggered at specific frequencies and amplitudes. One of the droplets contains dye, allowing the mixing process to be meticulously examined through the distribution of dye concentration. The objective of this work is to numerically explore the mechanism by which parametric oscillation affects the mixing process of micro-droplets in EWOD devices, an area previously uninvestigated in the literature to the best of our knowledge. The following conclusions are drawn from the results presented:
First, the presence of parametric oscillation significantly influences the distribution and intensity of vortices and shear rate within the droplet flow field. The internal flow of the droplet exhibits directional characteristics in both the up-down and azimuthal directions. Parametric oscillation, particularly in resonance mode, enhances vorticity magnitude and shear rate at the liquid-gas interface compared to cases without actuated oscillation. Vortices are predominantly concentrated near the intersections of the droplet’s lobes, with minimal appearance inside the droplet due to its laminar nature. The shear rate are primarily localized near and inside the liquid-gas interface, influenced by the droplet’s extension and retraction caused by parametric oscillation.
Second, parametric oscillation is proven as an effective method for enhancing mixing in micro-droplets compared to free oscillation. At , droplets under AC voltage-actuated oscillation, particularly in Cases R2-30-60 and R1.34-30-60, exhibit near-complete mixing, as indicated by the mixing index . This is in contrast to free oscillation cases where no AC voltage is applied. The heightened vorticity and shear rate near the liquid-gas interface, a result of parametric oscillation, are key factors contributing to the enhanced mixing. Vortices near the interface accelerate mass transfer, while shear rate disrupt the fluid’s laminar structure, promoting inter-component mixing.
Finally, it is highlighted that parametric oscillation not only enhances mixing but also introduces significant fluctuations in the mixing index curve. These fluctuations, termed , are evident in all parametric oscillation cases studied, invisible for free oscillation and no parametric oscillation cases. The smoothed curves, obtained through the locally weighted scatter plot smooth method, reveal the fluctuation patterns induced by parametric oscillation. The main fluctuating frequency of aligns with the driving frequency , confirming the role of parametric oscillation in generating these fluctuations. The mechanism behind is explained through the analysis of dye distribution within the droplet, showing how the droplet’s shape transformation from spherical to star-shaped configurations leads to the convergence and coalescence of dye lobes, resulting in local maxima of the mixing index. The frequency of is predicted to be twice that of the parametric oscillation frequency, which is consistent with FFT results and the correlation between the peaks of and the most star-like moment . This proposed mechanism provides a comprehensive understanding of how parametric oscillation influences the mixing process in droplets.
Ultimately, this research underscores the potential of parametric oscillation as a powerful tool for enhancing mixing in micro-droplets within EWOD systems. The detailed insights into the mechanisms behind mixing index fluctuations provide a novel understanding of droplet mixing dynamics, which can be directly applied to improve the design and operation of microfluidic devices for applications requiring efficient and controlled mixing processes.
Statements
Data availability statement
The original contributions presented in the study are included in the article/supplementary material, further inquiries can be directed to the corresponding author.
Author contributions
The first author, YW, conceptualization, methodology, numerical computation, and draft writing. The second author, JZ, funding acquisition, project administration, supervision, and draft reviewer. The third author, ZZ, investigation and methodology. The fourth author, JS, investigation and methodology. All authors contributed to the article and approved the submitted version.
Funding
The author(s) declare that financial support was received for the research, authorship, and/or publication of this article. The authors acknowledge financial support from the National Natural Science Foundation of China (Grant No. 12172329) and the National Science and Technology Major Project (Nos J2019-III-0004-0047 and 2019-III-0014-0058).
Conflict of interest
The authors declare that the research was conducted in the absence of any commercial or financial relationships that could be construed as a potential conflict of interest.
Generative AI statement
The author(s) declare that no Generative AI was used in the creation of this manuscript.
References
1.
Krakos A . Lab-on-chip Technologies for Space Research — Current Trends and Prospects. Microchim Acta (2024) 191:31–21. 10.1007/s00604-023-06084-4
2.
Snyder JE Walsh D Carr PA Rothschild LJ . A Makerspace for Life Support Systems in Space. Trends Biotechnol (2019) 37:1164–74. 10.1016/j.tibtech.2019.05.003
3.
Zangheri M Mirasoli M Guardigli M Di Nardo F Anfossi L Baggiani C et al Chemiluminescence-based Biosensor for Monitoring Astronauts’ Health Status during Space Missions: Results from the International Space Station. Biosens Bioelectron (2019) 129:260–8. 10.1016/j.bios.2018.09.059
4.
Medha M Roy A . Microgravity: New Aspect for Breast Cancer Treatment, a Review. Acta Astronaut. (2022) 190:62–73. 10.1016/j.actaastro.2021.09.045
5.
Grimm D Schulz H Krüger M Cortés-Sánchez JL Egli M Kraus A et al The Fight against Cancer by Microgravity: The Multicellular Spheroid as a Metastasis Model. Int J Mol Sci (2022) 23:3073. 10.3390/ijms23063073
6.
Mu X He W Rivera VAM De Alba RAD Newman DJ Zhang YS . Small Tissue Chips with Big Opportunities for Space Medicine. Life Sci Space Res (2022) 35:150–7. 10.1016/j.lssr.2022.09.002
7.
Yau A Wang Z Ponthempilly N Zhang Y Wang X Chen Y . Biosensor Integrated Tissue Chips and Their Applications on Earth and in Space. Biosens Bioelectron (2023) 222:114820. 10.1016/j.bios.2022.114820
8.
Tran QD Tran NN Hessel V . Frontier Medical Technologies to Support Space Exploration. In Space Manufacturing and Resources (John Wiley and Sons, Ltd) (2022). 47–65. 10.1002/9783527830909.ch3
9.
Krüger M Pietsch J Bauer J Kopp S Carvalho DTO Baatout S et al Growth of Endothelial Cells in Space and in Simulated Microgravity – A Comparison on the Secretory Level. Cell. Physiol. Biochem. (2019) 52:1039–60. 10.33594/000000071
10.
Pietsch J Gass S Nebuloni S Echegoyen D Riwaldt S Baake C et al Three-Dimensional Growth of Human Endothelial Cells in an Automated Cell Culture Experiment Container during the SpaceX CRS-8 ISS Space Mission – The SPHEROIDS Project. Biomaterials (2017) 124:126–56. 10.1016/j.biomaterials.2017.02.005
11.
Liu X Ma D Ye H Hou Y Bai X Xing Y et al Electrowetting-based Digital Microfluidics: Toward a Full-Functional Miniaturized Platform for Biochemical and Biological Applications. Trac, Trends Anal Chem (2023) 166:117153. 10.1016/j.trac.2023.117153
12.
Min X Kim WS . Beyond High Voltage in the Digital Microfluidic Devices for an Integrated Portable Sensing System. Microfluid Nanofluid (2019) 23:127–14. 10.1007/s10404-019-2294-y
13.
Wikramanayake E Hale R Elam J Shahriari A Bahadur V Alvarez-Hernandez AR et al “Characterizing Microfluidic Operations Underlying an Electrowetting Heat Pipe on the International Space Station,” in Proceedings of the ASME 2018 International Mechanical Engineering Congress and Exposition, Pittsburgh, PA, November 9–15, 2018. Vol. 7 (ASME) (2019). 10.1115/IMECE2018-86223
14.
Nijhuis J Schmidt S Tran NN Hessel V . Microfluidics and Macrofluidics in Space: ISS-Proven Fluidic Transport and Handling Concepts. Front Space Technol (2022) 2:779696. 10.3389/frspt.2021.779696
15.
Wang M Fu Q Liu R Wang C Li X Sun X et al A Microfluidic Manipulation Platform Based on Droplet Mixing Technology. Chem Eng Sci (2024) 298:120422. 10.1016/j.ces.2024.120422
16.
Paik P Pamula VK Fair RB . Rapid Droplet Mixers for Digital Microfluidic Systems. Lab Chip (2003) 3:253–9. 10.1039/B307628H
17.
Samiei E Tabrizian M Hoorfar M . A Review of Digital Microfluidics as Portable Platforms for Lab-On A-Chip Applications. Lab Chip (2016) 16:2376–96. 10.1039/C6LC00387G
18.
Lu Y Zhang M Zhang H Huang J Wang Z Yun Z et al On-chip Acoustic Mixer Integration of Electro-Microfluidics towards In-Situ and Efficient Mixing in Droplets. Microfluid Nanofluid (2018) 22:146–12. 10.1007/s10404-018-2169-7
19.
Mugele F Baret J-C Steinhauser D . Microfluidic Mixing through Electrowetting-Induced Droplet Oscillations. Appl Phys Lett (2006) 88:204106. 10.1063/1.2204831
20.
Zhang T Zhou P Simon T Cui T . Internal Flow in Sessile Droplets Induced by Substrate Oscillation: Towards Enhanced Mixing and Mass Transfer in Microfluidic Systems. Microsyst Nanoeng (2024) 10:86–11. 10.1038/s41378-024-00714-4
21.
Bono S Kinugasa H Kajita H Konishi S . Resonant Oscillation of Droplets Under an Alternating Electric Field to Enhance Solute Diffusion. Sci Rep (2024) 14:21326–8. 10.1038/s41598-024-72089-5
22.
Miraghaie R Sterling JD Nadim A . Shape Oscillation and Internal Mixing in Sessile Liquid Drops Using Electrowetting-On-Dielectric (EWOD). ResearchGate (2006) 2:610–3.
23.
Lee JH Lee KH Won JM Rhee K Chung SK . Mobile Oscillating Bubble Actuated by AC-Electrowetting-On-Dielectric (EWOD) for Microfluidic Mixing Enhancement. Sens Actuators, A (2012) 182:153–62. 10.1016/j.sna.2012.05.022
24.
Bansal S Sen P . Mixing Enhancement by Degenerate Modes in Electrically Actuated Sessile Droplets. Sens Actuators, B (2016) 232:318–26. 10.1016/j.snb.2016.03.109
25.
Hu Q Ren Y Liu W Chen X Tao Y Jiang H . Fluid Flow and Mixing Induced by AC Continuous Electrowetting of Liquid Metal Droplet. Micromachines (2017) 8:119. 10.3390/mi8040119
26.
Lee C-P Chen H-C Lai M-F . Electrowetting on Dielectric Driven Droplet Resonance and Mixing Enhancement in Parallel-Plate Configuration. Biomicrofluidics (2012) 6:12814–128148. 10.1063/1.3673258
27.
Wei Y Zou J Zhou C Li F Zhao Z . Numerical Investigation of Micro-Droplets Mixing in Electrowetting-On-Dielectric Digital Microfluidics: The Merging Process and Frequency Response. Phys Fluids (2022) 34:102009. 10.1063/5.0114475
28.
Malk R Fouillet Y Davoust L . Rotating Flow within a Droplet Actuated with AC EWOD. Proced Chem (2009) 1:1107–10. 10.1016/j.proche.2009.07.276
29.
Hong FJ Jiang DD Cheng P . Frequency-dependent Resonance and Asymmetric Droplet Oscillation under Ac Electrowetting on Coplanar Electrodes. J Micromech Microeng (2012) 22:085024. 10.1088/0960-1317/22/8/085024
30.
Berthier J . Micro-Drops and Digital Microfluidics. Norwich, NY: William Andrew Publishing (2013). 10.1016/C2011-0-05581-3
31.
Yamamoto Y Ito T Wakimoto T Katoh K . Numerical and Theoretical Analyses of the Dynamics of Droplets Driven by Electrowetting on Dielectric in a Hele-Shaw Cell. J Fluid Mech (2018) 839:468–88. 10.1017/jfm.2018.16
32.
Barber RW Emerson DR . Recent Advances in Electrowetting Microdroplet Technologies. In: Microdroplet Technology. New York, NY, USA: Springer (2012). p. 77–116. 10.1007/978-1-4614-3265-4_4
33.
Guan Y Li B Xing L . Numerical Investigation of Electrowetting-Based Droplet Splitting in Closed Digital Microfluidic System: Dynamics, Mode, and Satellite Droplet. Phys Fluids (2018) 30:112001. 10.1063/1.5049511
34.
Bouillant A Cohen C Clanet C Quéré D . Self-excitation of Leidenfrost Drops and Consequences on Their Stability. Proc Natl Acad Sci USA (2021) 118:e2021691118. 10.1073/pnas.2021691118
35.
Dong J Liu Y Xu Q Wang Y Wang S . Surface Parametric Instability of Star-Shaped Oscillating Liquid Drops. Phys Fluids (2019) 31:087104. 10.1063/1.5112007
36.
Brunet P Snoeijer JH . Star-Drops Formed by Periodic Excitation and on an Air Cushion - a Short Review. The Eur Phys J Spec Top (2011) 192:207–26. 10.1140/epjst/e2011-01375-5
37.
Okada M Okada M . Observation of the Shape of a Water Drop on an Oscillating Teflon Plate. Experiments in Fluids (2006) 41:789–802. 10.1007/s00348-006-0203-0
38.
Pang X Duan M Liu H Xi Y Shi H Li X . Oscillation-induced Mixing Advances the Functionality of Liquid Marble Microreactors. ACS Appl Mater and Inter (2022) 14:11999–2009. 10.1021/acsami.1c22314
39.
Chang C-T Bostwick JB Daniel S Steen PH . Dynamics of Sessile Drops. Part 2. Experiment. J Fluid Mech (2015) 768:442–67. 10.1017/jfm.2015.99
40.
Mampallil D Burak Eral H Staicu A Mugele F van den Ende D . Electrowetting-driven Oscillating Drops Sandwiched between Two Substrates. Phys Rev E (2013) 88:053015. 10.1103/PhysRevE.88.053015
41.
Shen CL Xie W Yan ZL Wei B . Internal Flow of Acoustically Levitated Drops Undergoing Sectorial Oscillations. Phys Lett A (2010) 374:4045–8. 10.1016/j.physleta.2010.07.071
42.
Theisen J Davoust L . Mass Transfer Enhancement and Surface Functionalization in Digital Microfluidics Using AC Electrowetting: The Smaller, the Better. Microfluid Nanofluid (2015) 18:1373–89. 10.1007/s10404-014-1536-2
Summary
Keywords
electrowetting-on-dielectric (EWOD), microfluidic systems, parametric oscillation, mixing efficiency, numerical simulation
Citation
Wei Y, Zou J, Zhao Z and Sun J (2025) Enhancing Micro-Droplet Mixing in Microfluidic Systems Via Electrowetting-Induced Parametric Oscillations. Aerosp. Res. Commun. 2:14205. doi: 10.3389/arc.2024.14205
Received
13 December 2024
Accepted
23 December 2024
Published
09 January 2025
Volume
2 - 2024
Updates
Copyright
© 2025 Wei, Zou, Zhao and Sun.
This is an open-access article distributed under the terms of the Creative Commons Attribution License (CC BY). The use, distribution or reproduction in other forums is permitted, provided the original author(s) and the copyright owner(s) are credited and that the original publication in this journal is cited, in accordance with accepted academic practice. No use, distribution or reproduction is permitted which does not comply with these terms.
*Correspondence: Jianfeng Zou, zoujianfeng@zju.edu.cn
Disclaimer
All claims expressed in this article are solely those of the authors and do not necessarily represent those of their affiliated organizations, or those of the publisher, the editors and the reviewers. Any product that may be evaluated in this article or claim that may be made by its manufacturer is not guaranteed or endorsed by the publisher.